
Uploaded by
cuyler
1 SLIDES
135 VIEWS
10LIKES
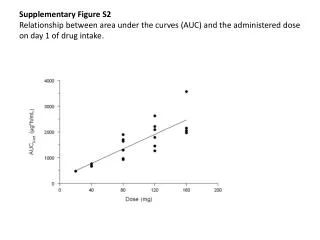
Relationship Between Area Under the Curves (AUC) and Administered Dose on Day 1 of Drug Intake
DESCRIPTION
This supplementary figure illustrates the correlation between the area under the curves (AUC) and the administered dose of a drug on the first day of intake. It analyzes how varying dosages impact drug absorption over time, providing insights into pharmacokinetics. Understanding this relationship is crucial for optimizing dosing regimens to achieve desired therapeutic effects while minimizing adverse outcomes.
Download
1 / 1
Download Presentation 
Relationship Between Area Under the Curves (AUC) and Administered Dose on Day 1 of Drug Intake
An Image/Link below is provided (as is) to download presentation
Download Policy: Content on the Website is provided to you AS IS for your information and personal use and may not be sold / licensed / shared on other websites without getting consent from its author.
Content is provided to you AS IS for your information and personal use only.
Download presentation by click this link.
While downloading, if for some reason you are not able to download a presentation, the publisher may have deleted the file from their server.
During download, if you can't get a presentation, the file might be deleted by the publisher.
E N D
Presentation Transcript
Supplementary Figure S2Relationship between area under the curves (AUC) and the administered dose on day 1 of drug intake.
More Related