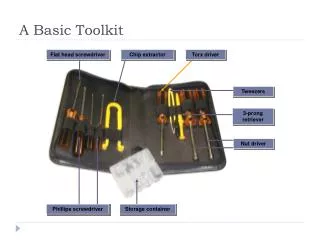
A basic budget analysis toolkit
A basic budget analysis toolkit. Overview. Four budget analysis techniques used by analysts and presented in budget and policy documents. Look at percentage shares, percentage changes, average annual percentage changes, and converting from nominal to real figures. Each section:

A basic budget analysis toolkit
E N D
Presentation Transcript
Overview • Four budget analysis techniques used by analysts and presented in budget and policy documents. • Look at percentage shares, percentage changes, average annual percentage changes, and converting from nominal to real figures. • Each section: • Outlines the purpose of a calculation; • Gives relevant formula; • Illustrates the use of the technique with an example. • Suggestions for graphical representation are made. • Use the Thai budget for practicing each technique.
1-Percentageshares • Purpose: Percentage shares indicate relative priorities at one point in time. • How to calculate percentage shares: %
1 - Percentage shares • Purpose: Percentage shares indicate relative priorities at one point in time. • How to calculate percentage shares:
Fictitious example The government spends $25 million on building new health clinics in rural areas. Total health expenditure amounts to $489 million. What share of the health budget is spent on the new clinics? Answer…?
Over to you for an exercise… Let’s try this with real data from the 2004 Thai budget. • The Ministry of Defense got 80.7 billion Baht as its “budget appropriation” for the 2004 fiscal year. Total appropriations amounted to 1163.5 billion Baht. • What percentage share of total appropriations did the Ministry of Defense receive?
2 – Percentage change • Purpose: Calculating percentage changes for different items in a budget gives you a good idea of how priorities are shifting between time periods, e.g. years. • Ifthe percentage change of a particular expenditure item is less (more) than the percentage change of total expenditures, then the percentage share of that item in total spending will be lower (higher) than in the previous period. • How to calculate percentage change?
2 – Percentage change How to calculate percentage change:
Fictitious example • Parliament allocated $120 million for primary education in 2000 and $105 million in the following year. • What is the percentage change in primary education expenditures between 2000 and 2001? Answer…?
Fictitious example • Parliament allocated $120 million for primary education in 2000 and $105 million in the following year. What is the percentage change in primary education expenditures between 2000 and 2001? • Answer:
Over to you for an exercise… • Let’s try this with real data from the Thai budget. • The Bank of Thailand reports that total capital expenditures amounted to 210.6 billion Baht in the 2002 fiscal year and 163.2 billion Baht in the 2003 fiscal year. • What was the percentage change?
3 – Average annual percentage change • Purpose: To get a better idea of the overall long-term trend in spending growth, we can take the average of the annual percentage changes over a period of time. • This ignores year-on-year fluctuations within the respective period. • How to calculate average annual percentage change:
3 – Average annual percentage change • Purpose: To get a better idea of the overall long-term trend in spending growth, we can take the average of the annual percentage changes over a period of time. • This ignores year-on-year fluctuations within the period. • How to calculate average annual percentage change:
Fictitious example • The government spent $60 million on funding for certain cultural activities in 1999 (t), rising to $71 million in 2000 (t+1), $93 million in 2001 (t+2) and $103 million in 2002 (t+3) and $120 million in 2003 (t+4). • What is the average annual percentage change between 1999 and 2003? Answer…?
Fictitious example • The government spent $60 million on funding for certain cultural activities in 1999 (t), rising to $71 million in 2000 (t+1), $93 million in 2001 (t+2) and $103 million in 2002 (t+3) and $120 million in 2003 (t+4). What is the average annual percentage change between 1999 and 2003? • Answer:
Over to you for an exercise… • Let’s try this with real data from the Thai budget. • The Bank of Thailand reports that total interest payments were 69 billion Baht in the 2002 fiscal year, 65.1 billion Baht in the 2003 fiscal year, and 70.2 billion Baht in the 2004 fiscal year. • What was the average annual percentage change?
Another exercise… • In FY 1998 the national government spent 126.3 billion Baht on “transport and communication”. It then spent 98.5 billion in FY 1999, 92.8 billion in FY 2000 and 77.7 billion in FY 2001. • What was the average annual percentage change?
And another exercise… • In FY 1998 the national government spent 61.1 billion Baht on “agriculture, forestry and fisheries”. In FY 2003 it spent 69.5 billion for the same function. • What was the average annual percentage change?
4 – Adjusting for inflation • Purpose: By converting a nominal amount into a real amount, we adjust for inflation. • Taking into account changes in prices gives us a better idea of purchasing power, i.e. how much can actually be bought with a certain sum of money compared with previous points in time. • How to calculate real amounts: • Construct deflators • Convert from nominal into real
Step two – convert from nominal to real • Divide the nominal expenditure amount for a given year by the deflator for that year:
Over to you for an exercise… • Let’s try this with real data from the Thai budget. • We have already seen that total interest payments were 69 billion Baht in the 2002 fiscal year, 65.1 billion in FY 2003 and 70.2 billion in FY 2004. • The Bank of Thailand reports headline inflation of 0.7% for 2002 and 1.8% for 2003. It projects around 2.75% for 2004. • NB: The inflation figures are for calendar years, not fiscal years. The difference is likely to be small, but you should use consistent data for any analytical work. We pretend here that the data cover the same period. • What are real total interest payments between 2002 and 2004, taking 2002 as the base year?
And another exercise… • In FY 1998 the national government spent 212.2 billion Baht on education, then 215.3 billion in FY 1999, 218.6 billion in FY 2000, 223.0 billion in FY 2001, and 223.1 billion in FY 2002. • Consumer price inflation was 8.08% (1998), 0.31% (1999), 1.55% (2000), 1.66 (2001), and 0.6% (2002). • What was expenditure on health in real terms between 1998 and 2002, taking 1998 as the base year?
More about deflators • Try to get a hold of deflators from the Finance Ministry or the Central Bank before you construct them yourself. • If you can’t find them in the budget documentation, call the Ministry/Bank! • The more commonly used deflator in budget analysis is the GDP deflator, more broadly based compared with deflators based on the Consumer/Retail Price Index or similar measures. • It’s correct to use either, but make sure you state which deflator you use for your analysis and where you got it from.
Concluding remarks • Congratulations! You have just reviewed four essential budget analysis techniques. • These types of analyses are only useful if you also provide an interpretation of your findings, i.e. what is the “story” that is revealed by the analysis? • Invest time in presenting your data in a straightforward and well designed way. • Never present data just for its own sake, without a good reason. • Spreadsheet programs can be used for any of these calculations and to present the data in the form of graphs or charts.