Download
1 / 17
170 likes | 197 Views
This study presents a new determination of the positive muon lifetime with unprecedented precision, using advanced measurement techniques and data analysis. The measurement provides a reference lifetime for precision muon capture experiments and contributes to the understanding of weak interactions.

E N D
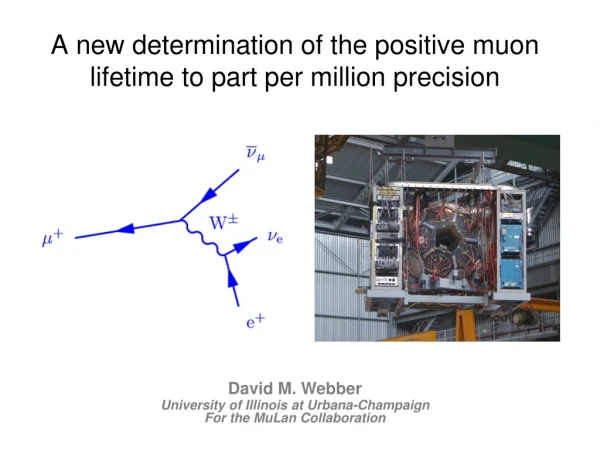
A new determination of the positive muon lifetime to part per million precision David M. Webber University of Illinois at Urbana-Champaign For the MuLan Collaboration
Motivation • gives the Fermi Constant to very high precision (actually Gm) • needed for “reference” lifetime for precision muon capture experiments • MuCap: m- + p • MuSun: m- + d Capture rate from lifetime difference m-and m+ D. M. Webber
Contains all weak interaction loop corrections Dq The Fermi constant is related to the electroweak gauge coupling g by In the Fermi theory, muon decay is a contact interaction where Dq includes phase space, QED, hadronic and radiative corrections In 1999, van Ritbergen and Stuart completed full 2-loop QED corrections reducing the uncertainty in GF from theory to < 0.3 ppm (it was the dominant error before) D. M. Webber
The experimental concept in one animation … Real data Fast-switching electric kicker on Measurement Period Number (log scale) time Fill Period 100% polarized muons at ~4 MeV -12.5 kV B 12.5 kV Kicker Systematic Uncertainty < 0.2 ppm D. M. Webber Rapidly precess
Waveform Digitizers 2 Analog Pulses 1/6 of system 170 scintillator tile pairs readout using 450 MHz waveform digitizers. x2 1 clock tick = 2.2 ns Uncertainty from electronics stability: 0.26 ppm D. M. Webber
MuLan collected two datasets, each containing 1012 muon decays. Ferromagnetic Target, 2006 Quartz Target, 2007 • Two (very different) data sets • 2006: • Ferromagnetic target dephases muon ensemble • 1.18 ppm statistical uncertainty • 2007: • Quartz target forms 90% muonium, 10% free (precessing) muons • 1.7 ppm statistical uncertainty D. M. Webber
Two pulses close together A difficult fit Fits of raw waveforms using Templates >2 x 10¹² / data set >135 TBytes raw data Normal Pulse D. M. Webber
Measured t vs. Deadtime Normal Time Distribution RawSpectrum Pileup Corrected Pileup Time Distribution Leading order pileup • Same probability • Statistically reconstruct • pileup time distribution • Fit corrected distribution D. M. Webber
R (ppm) 1 ppm 150 ns deadtime range Artificial Deadtime (ct) Pileup to sub-ppm requires higher-order terms • 12 ns deadtime, pileup has a 5 x 10⁻⁴ probability at our rates • Proof of procedure validated with detailed Monte Carlo simulation • Over 1012 MC events generated uncorrected Pileup terms at different orders … D. M. Webber
R (ppm) 1 ppm 150 ns deadtime range Artificial Deadtime (ct) Lifetime vs artificially imposed deadtime window is an important diagnostic • A slight slope exists, which we continue to investigate Extrapolation to 0 deadtime should be correct answer and our indications are that this extrapolation is right D. M. Webber Pileup Correction Uncertainty: 0.2 ppm
R vs fit start time Red band is the set-subset allowed variance 2006: Fit of 30,000 AK-3 pileup-corrected runs ppm tm + Dsecret 22 ms Clock Ticks (1 clock tick ~ 2.2 ns) D. M. Webber
2007: Quartz data fits well as a simple sum, exploiting the symmetry of the detector. The mSR remnants vanish. D. M. Webber
MuLan Systematic Uncertainties (preliminary) D=0.3 ppm! Total Uncertainty: 1.3 ppm For the rest of the talk I will use 1.3 ppm, but it should decrease as studies finalize. D. M. Webber
New MuLan ResultLifetime value final, preliminary error will decrease MuLan 2007: = 2196980.7 ± 3.7(stat) ± 1.9(sys) ps MuLan 2006: = 2196980.1 ± 2.6(stat) ± 1.9(sys) ps 2006 & 2007 avg: = 2196980.3 ± 2.8 ps (1.3 ppm) GF = 1.166 381 8 (8) x 10-5 GeV-2(0.7 ppm)* *includes 0.43 ppm shift on Δq from linear me term (Pak & Czarnecki, 2008) D. M. Webber
FAST MuLan 2004 D. M. Webber
MuLan Collaborators Institutions: University of Illinois at Urbana-Champaign University of California, Berkeley TRIUMF University of Kentucky Boston University James Madison University Groningen University Kentucky Wesleyan College 2004 2006 2007 D. M. Webber
MuLan measured the muon lifetime to ppm-level precision. • MuLan measurement is most precise (and accurate) • MuLan = 2196980.3 ± 2.8 ps • Lifetime value final, preliminary error will decrease • Combined uncertainty 1.3 ppm • GF = 1.166 381 8(8) x 10-5 GeV-2 D. M. Webber