Download
1 / 29
290 likes | 509 Views
Protein Strucure Comparison. Chapter 6,7 Orengo. Describing Coarse Level Structure. Helices. α -helix 4-turn helix, min. 4 residues 3 10 -helix 3-turn helix, min. 3 residues π -helix 5-turn helix, min. 5 residues. Formed by H-Bonds between residues in the same helix.

E N D
Protein Strucure Comparison Chapter 6,7 Orengo
Describing Coarse Level Structure Helices • α-helix 4-turn helix, min. 4 residues 310-helix 3-turn helix, min. 3 residues π-helix 5-turn helix, min. 5 residues • Formed by H-Bonds between residues in the same helix
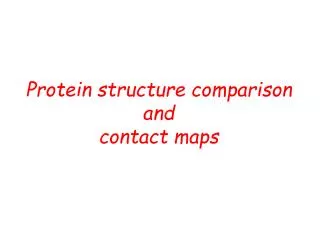
Describing Coarse Level Structure Strands and Sheets • Formed by successive H-Bonds between residues can be far apart in sequence.
Cartoons for Secondary Structure Elements (SSE) • Topology of Protein Structure (TOPS) • Triangular symbols represent beta strands • Circular symbols represent helices (alpha and 310)
Some families show great structural diversity Gabrielle Reeves Multiple structural alignment by CORA allows identification of consensus secondary structure and embellishments 2DSEC algorithm In 117 superfamilies relatives expanded by >2 fold or more These families represent more than half the genome sequences of known fold
Example • Alignment • ACSL-DRTS-IRV • A-TLREKSSLIR- • Know first 5 residues • ACSL-D • A-TLRE
But not so with structures Dynamic Programming cannot be used directly for structure alignment highest score alignment of entire structures highest score alignment of first five residues
Process Degrees of freedom include Equivalenced elements Rotation Translation (usually centroid)
Example • In two dimensions
Translation • In two dimensions Shift Centroids to the origin
Example HW 9.2 • In two dimensions • Rotation Matrix
The first step • Transpose centroids to the origin • Foreach angular displacement in x • Foreach angular displacement in y • Foreach angular displacement in x • Calculate RMSD • If this RMSD is less than current minimum, save it
But, how did we get the equivalenced elements? • First seed the problem with an initial equivalence E0 • Then find the Transformation that results in a minimum RMSD • Use this Transformation to find a better equivalence
Example The best rotation and translation is then found and a new alignment is generated
Structural Classification of Proteins (SCOP) SCOP describes protein structures using a hierarchical classification scheme: Classes Folds Superfamilies (likely evolutionary relationship) Families Domains Individual PDB entries http://scop.mrc-lmb.cam.ac.uk/scop/
Class, Architecture, Topology, and Homologous Superfamily (CATH) database CATH clusters proteins at four levels: C Class (a, b, a&b folds) A Architecture (shape of domain, e.g. jelly roll) T Topology (fold families; not necessarily homologous) H Homologous superfamily http://www.biochem.ucl.ac.uk/basm/cath_new Page 293