Download
1 / 5
50 likes | 104 Views
Learn to interpret and explain the meaning of points on graphs representing proportional relationships. Understand how to read a graph, identify proportional points, and relate them to real-life situations. Practice problems will solidify your understanding.

E N D
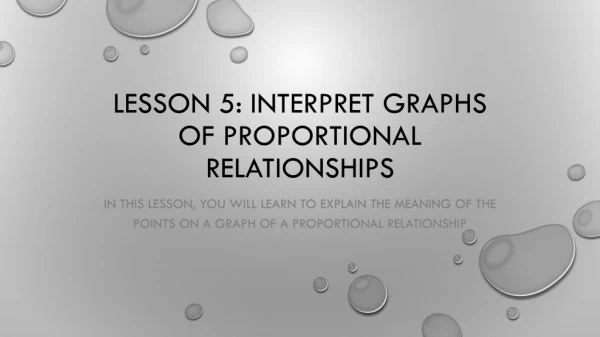
Lesson 5: Interpret graphs of proportional relationships In this lesson, you will learn to explain the meaning of the points on a graph of a proportional relationship
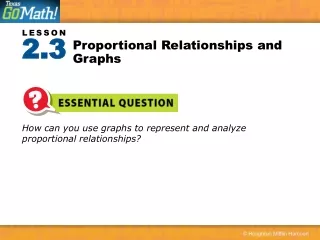
Essential Question: • What do the points on the graph of a proportional relationship mean in terms of the situation?
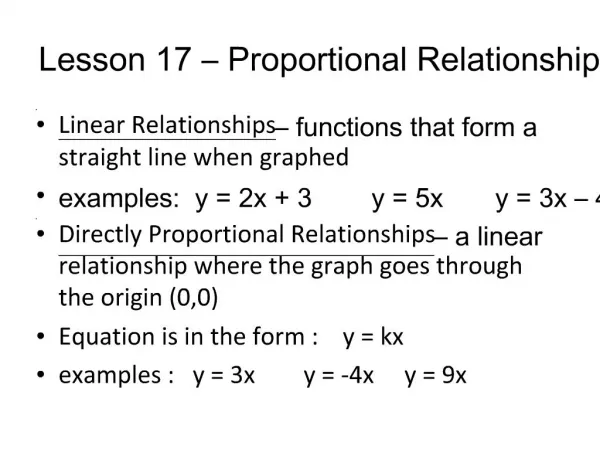
Reading a Graph : • Points on a graph are written as (x , Y) • The X axis runs horizontal and the y axis runs vertical • If two variables are proportional, every point on the graph will have the same Y to X ratio (unit rate) • Each point will be able to be put into the equation y = kx What makes a graph proportional?
Practice problem 1 When marta cooks, she often uses liquid egg whites instead of eggs. She made a graph that shows how many cups of egg whites (y) she uses to replace the eggs (X) in the recipe. What do the points (0,0) (1,1/4) (2, ½) and (3, ¾ ) mean?
Practice Problem 2 The equation y = 1½ x shows the relationship between x, the number of servings of soup, and y, the number of sweet potatoes. Draw a graph to show how the two quantities are related.