Download

1 / 22
0 likes | 10 Views
The research seminar discusses measuring poverty and social exclusion in the UK and Japan, focusing on public perceptions of necessities. A comparison between the two countries reveals differences in the perception of essential items for a decent standard of living. The study highlights historical, cultural, and economic factors influencing the differing perspectives on poverty in Japan. Recent data from Japan's 2011 Necessities Survey provides updated insights into societal views on essential needs.

E N D
Research Seminar The State of Art of Measuring Poverty and Social Exclusion in the UK and Japan IPSS, Tokyo Time: January 6th, 2012 9:00~18:00 Public Perception of Necessities in Japan Aya Abe (National Institute of Population & Social Security Research)
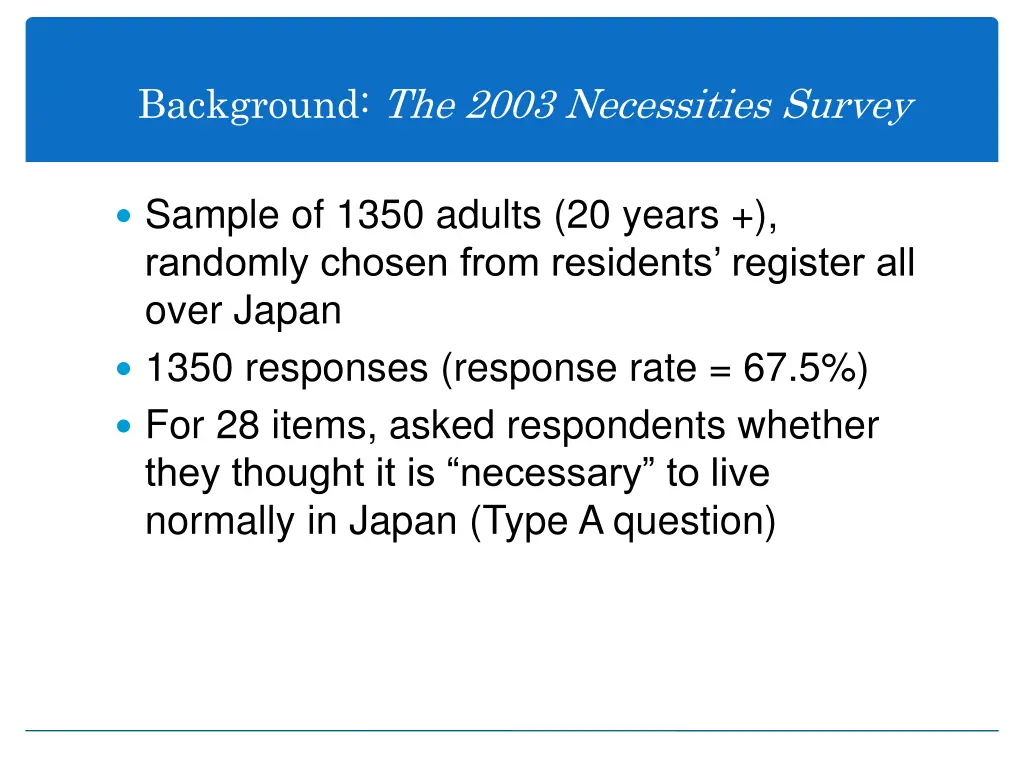
Background: The 2003 Necessities Survey Sample of 1350 adults (20 years +), randomly chosen from residents’ register all over Japan 1350 responses (response rate = 67.5%) For 28 items, asked respondents whether they thought it is “necessary” to live normally in Japan (Type A question)
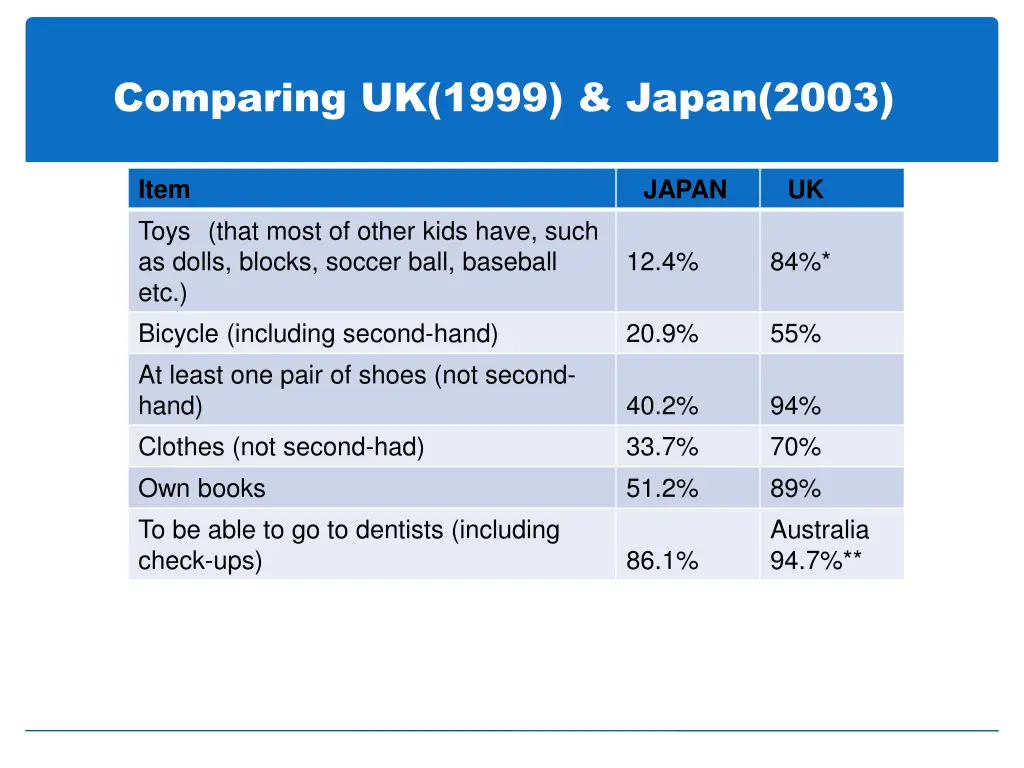
Comparing UK(1999) & Japan(2003) Item Toys (that most of other kids have, such as dolls, blocks, soccer ball, baseball etc.) Bicycle (including second-hand) At least one pair of shoes (not second- hand) Clothes (not second-had) Own books To be able to go to dentists (including check-ups) JAPAN UK 12.4% 84%* 20.9% 55% 40.2% 33.7% 51.2% 94% 70% 89% Australia 94.7%** 86.1% * UK question: “Toys (e.g. dolls, teddies) ** Australia : Community Understanding of Poverty and Social Exclusion Survey 2006 in Saunders et al. (2007) Data: Japan Child Necessity Survey 2008 in Abe (2008), UK Office for National Statistics Omnibus Survey 1999, in Gordon et al. (2000)
Why is there a such low support for necessities in Japan? “Poverty” was not an issue that was well-known in Japan in 2003. General public only had idea of “absolute” poverty Maybe a “wording problem”? Too rapid economic growth in the 60’s to 70’s -> “collective” memory of old days? Envy and nostalgia for “simple life”?
New Data The 2011 Necessities Survey Date Surveyed: May 2011 (Bad timing – too much after effect of the 3.11.2011. earthquake ??) Mail survey Sample of 3000 adults (20 years +), randomly chosen from survey company’s “monitors” 1518 responses (response rate = 50.6%)
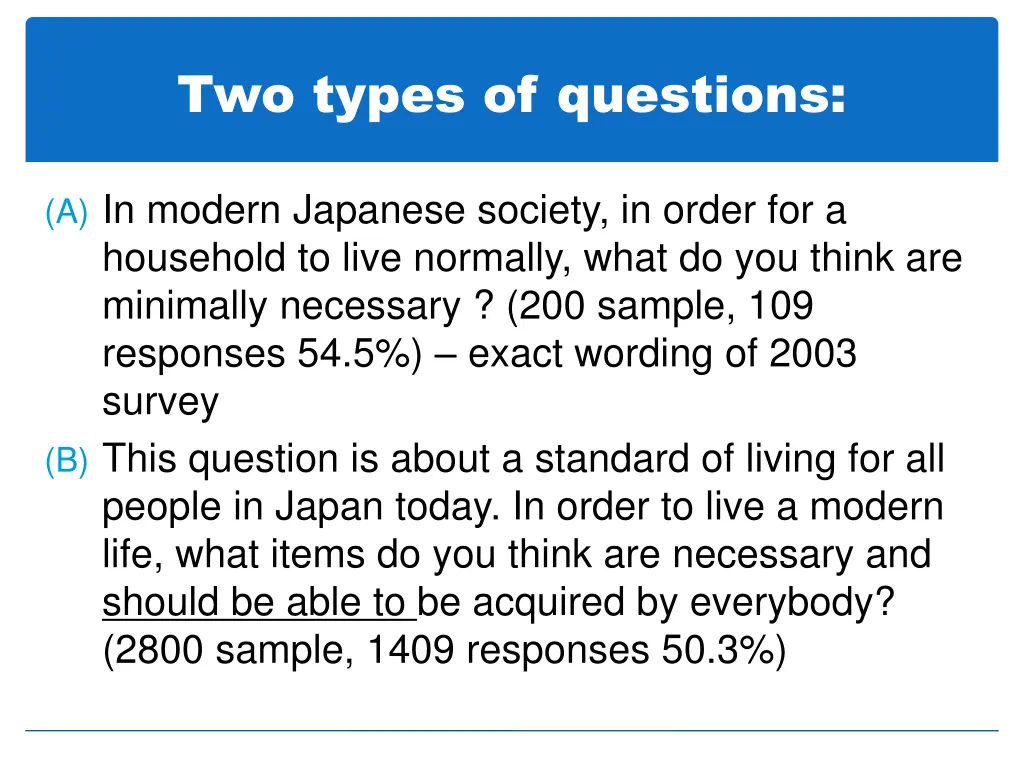
Two types of questions: (A) In modern Japanese society, in order for a household to live normally, what do you think are minimally necessary ? (200 sample, 109 responses 54.5%) – exact wording of 2003 survey (B) This question is about a standard of living for all people in Japan today. In order to live a modern life, what items do you think are necessary and should be able to be acquired by everybody? (2800 sample, 1409 responses 50.3%)
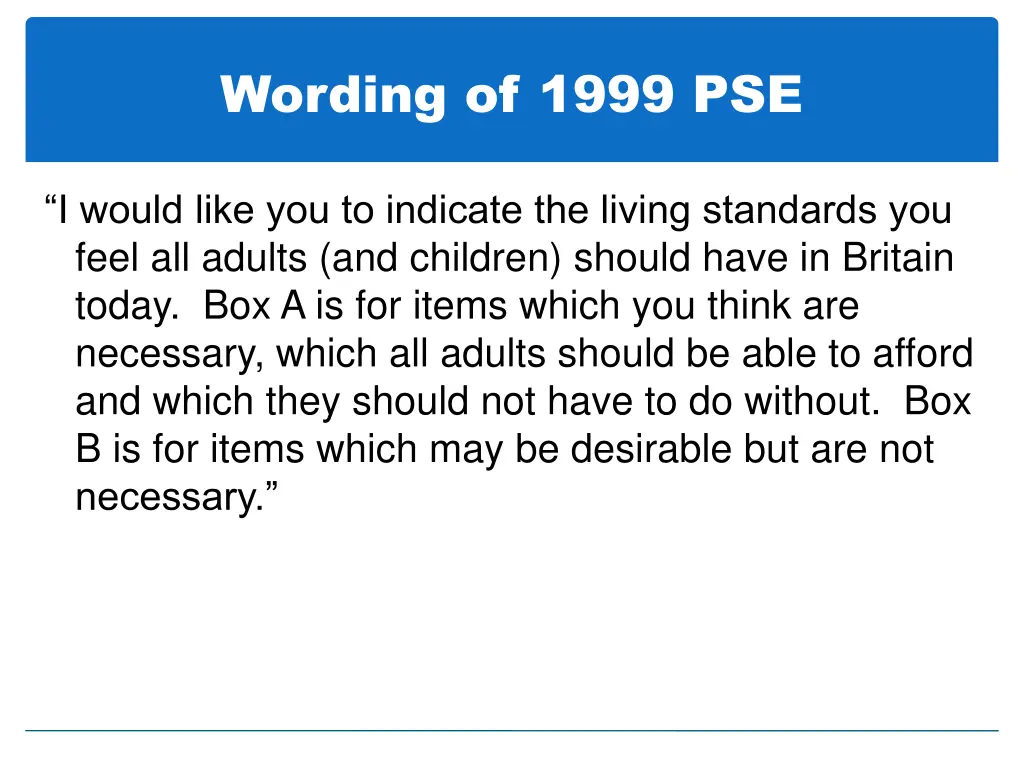
Wording of 1999 PSE “I would like you to indicate the living standards you feel all adults (and children) should have in Britain today. Box A is for items which you think are necessary, which all adults should be able to afford and which they should not have to do without. Box B is for items which may be desirable but are not necessary.”
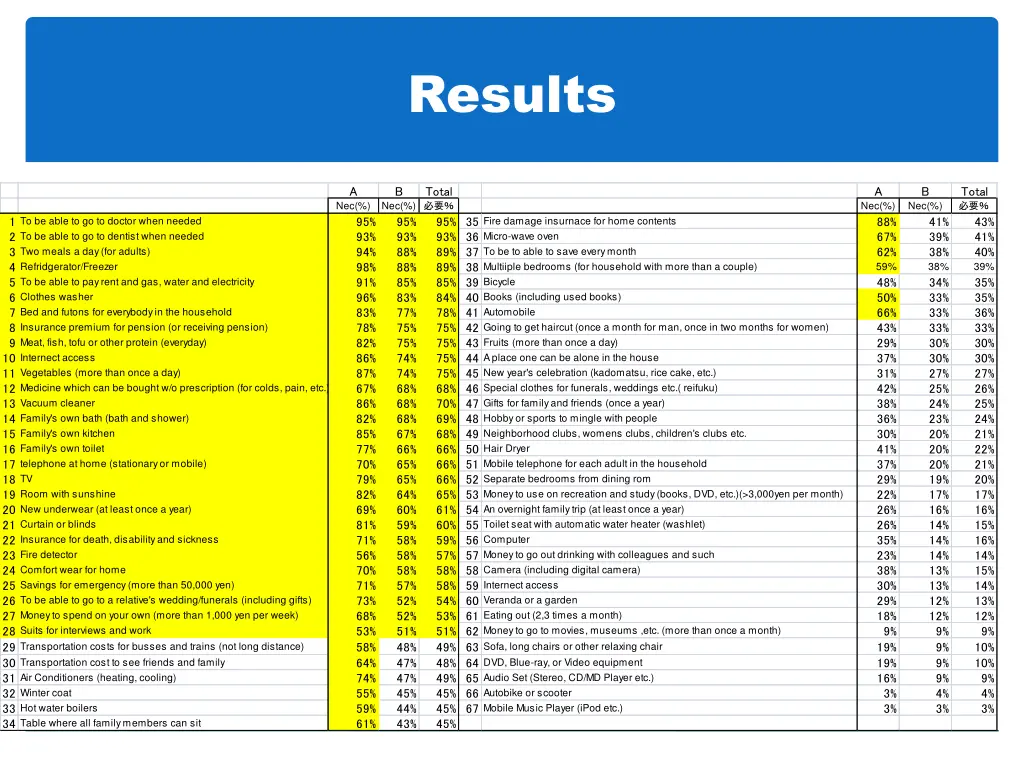
Results A B Total A B Total 必要% Nec(%) Nec(%) 必要% 95% 93% 88% 88% 85% 83% 77% 75% 75% 74% 74% 68% 68% 68% 67% 66% 65% 65% 64% 60% 59% 58% 58% 58% 57% 52% 52% 51% 48% 47% 47% 45% 44% 43% Nec(%) 88% 67% 62% 59% 48% 50% 66% 43% 29% 37% 31% 42% 38% 36% 30% 41% 37% 29% 22% 26% 26% 35% 23% 38% 30% 29% 18% Nec(%) 1To be able to go to doctor when needed 2To be able to go to dentist when needed 3Two meals a day (for adults) 4Refridgerator/Freezer 5To be able to pay rent and gas, water and electricity 6Clothes washer 7Bed and futons for everybody in the household 8Insurance premium for pension (or receiving pension) 9Meat, fish, tofu or other protein (everyday) 10Internect access 11Vegetables (more than once a day) 12Medicine which can be bought w/o prescription (for colds, pain, etc.) 13Vacuum cleaner 14Family's own bath (bath and shower) 15Family's own kitchen 16Family's own toilet 17telephone at home (stationary or mobile) 18TV 19Room with sunshine 20New underwear (at least once a year) 21Curtain or blinds 22Insurance for death, disability and sickness 23Fire detector 24Comfort wear for home 25Savings for emergency (more than 50,000 yen) 26To be able to go to a relative's wedding/funerals (including gifts) 27Money to spend on your own (more than 1,000 yen per week) 28Suits for interviews and work 29Transportation costs for busses and trains (not long distance) 30Transportation cost to see friends and family 31Air Conditioners (heating, cooling) 32Winter coat 33Hot water boilers 34Table where all family members can sit 95% 35Fire damage insurnace for home contents 93% 36Micro-wave oven 89% 37To be to able to save every month 89% 38Multiiple bedrooms (for household with more than a couple) 85% 39Bicycle 84% 40Books (including used books) 78% 41Automobile 75% 42Going to get haircut (once a month for man, once in two months for women) 75% 43Fruits (more than once a day) 75% 44A place one can be alone in the house 75% 45New year's celebration (kadomatsu, rice cake, etc.) 68% 46Special clothes for funerals, weddings etc.( reifuku) 70% 47Gifts for family and friends (once a year) 69% 48Hobby or sports to mingle with people 68% 49Neighborhood clubs, womens clubs, children's clubs etc. 66% 50Hair Dryer 66% 51Mobile telephone for each adult in the household 66% 52Separate bedrooms from dining rom 65% 53Money to use on recreation and study (books, DVD, etc.)(>3,000yen per month) 61% 54An overnight family trip (at least once a year) 60% 55Toilet seat with automatic water heater (washlet) 59% 56Computer 57% 57Money to go out drinking with colleagues and such 58% 58Camera (including digital camera) 58% 59Internect access 54% 60Veranda or a garden 53% 61Eating out (2,3 times a month) 51% 62Money to go to movies, museums ,etc. (more than once a month) 49% 63Sofa, long chairs or other relaxing chair 48% 64DVD, Blue-ray, or Video equipment 49% 65Audio Set (Stereo, CD/MD Player etc.) 45% 66Autobike or scooter 45% 67Mobile Music Player (iPod etc.) 45% 95% 93% 94% 98% 91% 96% 83% 78% 82% 86% 87% 67% 86% 82% 85% 77% 70% 79% 82% 69% 81% 71% 56% 70% 71% 73% 68% 53% 58% 64% 74% 55% 59% 61% 41% 39% 38% 38% 34% 33% 33% 33% 30% 30% 27% 25% 24% 23% 20% 20% 20% 19% 17% 16% 14% 14% 14% 13% 13% 12% 12% 9% 9% 9% 9% 4% 3% 43% 41% 40% 39% 35% 35% 36% 33% 30% 30% 27% 26% 25% 24% 21% 22% 21% 20% 17% 16% 15% 16% 14% 15% 14% 13% 12% 9% 10% 10% 9% 4% 3% 9% 19% 19% 16% 3% 3%
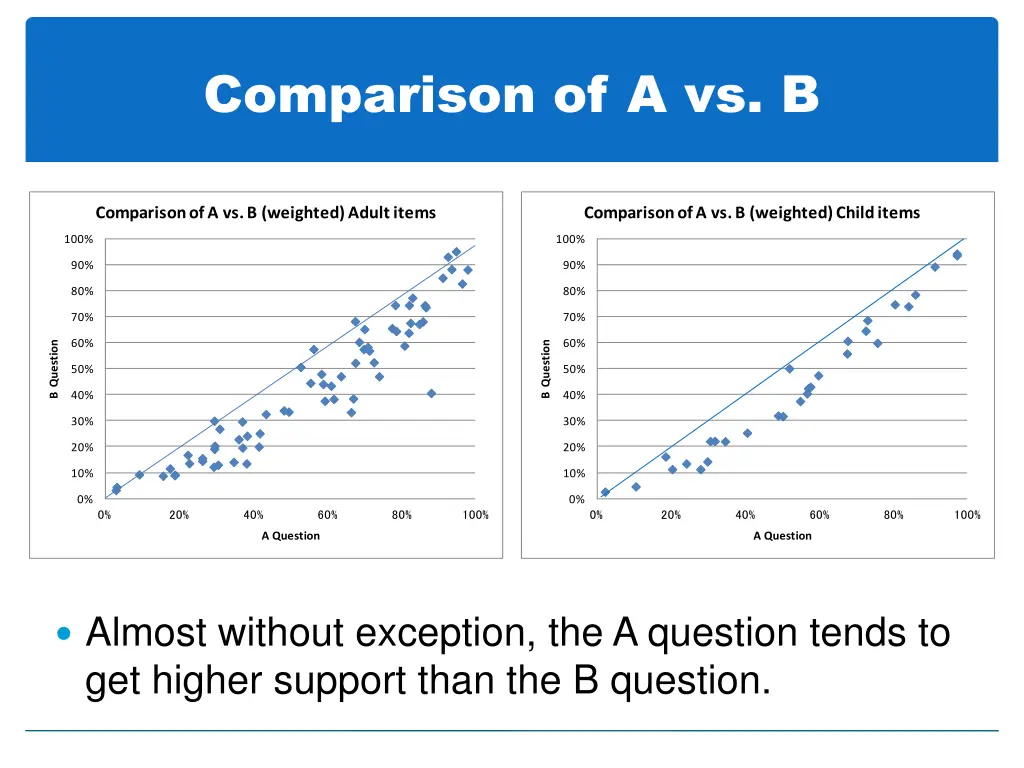
Comparison of A vs. B Comparison of A vs. B (weighted) Adult items Comparison of A vs. B (weighted) Child items 100% 100% 90% 90% 80% 80% 70% 70% 60% 60% B Question B Question 50% 50% 40% 40% 30% 30% 20% 20% 10% 10% 0% 0% 0% 20% 40% 60% 80% 100% 0% 20% 40% 60% 80% 100% A Question A Question Almost without exception, the A question tends to get higher support than the B question.
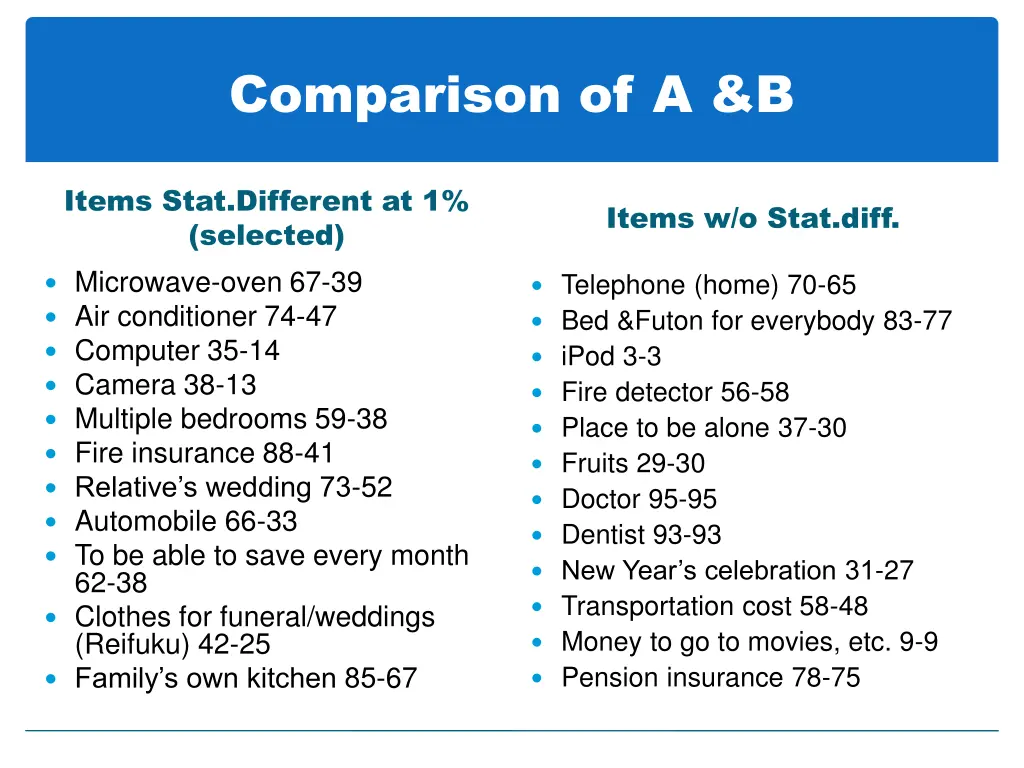
Comparison of A &B Items Stat.Different at 1% (selected) Microwave-oven 67-39 Air conditioner 74-47 Computer 35-14 Camera 38-13 Multiple bedrooms 59-38 Fire insurance 88-41 Relative’s wedding 73-52 Automobile 66-33 To be able to save every month 62-38 Clothes for funeral/weddings (Reifuku) 42-25 Family’s own kitchen 85-67 Items w/o Stat.diff. Telephone (home) 70-65 Bed &Futon for everybody 83-77 iPod 3-3 Fire detector 56-58 Place to be alone 37-30 Fruits 29-30 Doctor 95-95 Dentist 93-93 New Year’s celebration 31-27 Transportation cost 58-48 Money to go to movies, etc. 9-9 Pension insurance 78-75
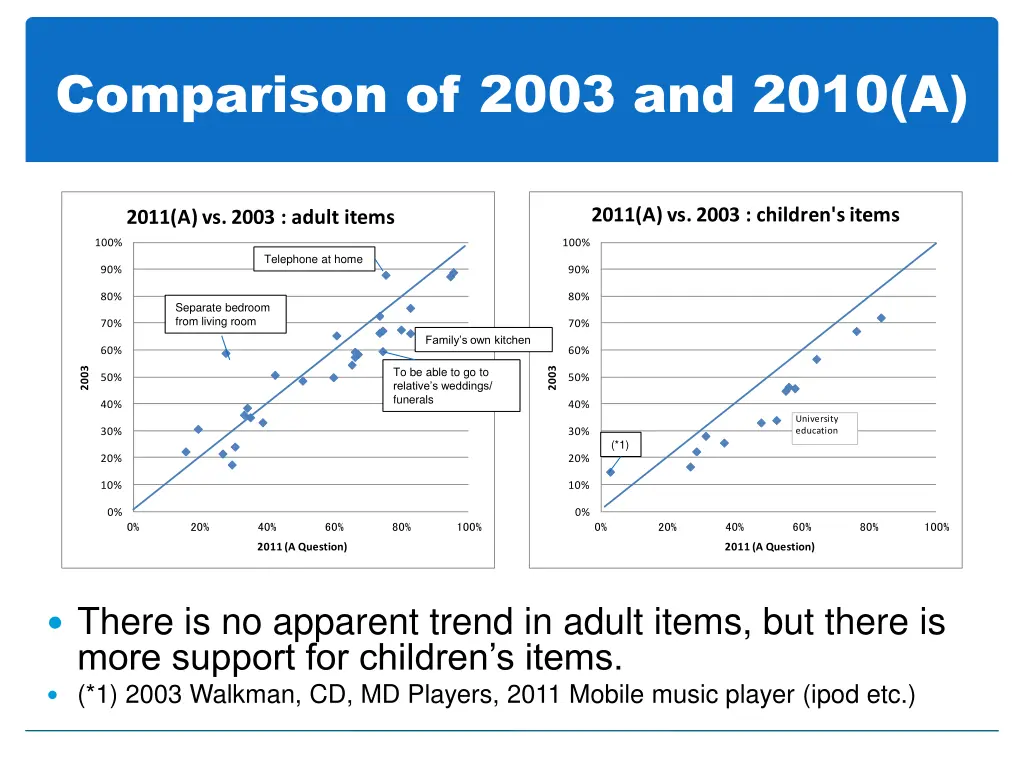
Comparison of 2003 and 2010(A) 2011(A) vs. 2003 : children's items 2011(A) vs. 2003 : adult items 100% 100% Telephone at home 90% 90% 80% 80% Separate bedroom from living room 70% 70% Family’s own kitchen 60% 60% To be able to go to relative’s weddings/ funerals 2003 2003 50% 50% 40% 40% University education 30% 30% (*1) 20% 20% 10% 10% 0% 0% 0% 20% 40% 60% 80% 100% 0% 20% 40% 60% 80% 100% 2011 (A Question) 2011 (A Question) There is no apparent trend in adult items, but there is more support for children’s items. (*1) 2003 Walkman, CD, MD Players, 2011 Mobile music player (ipod etc.)
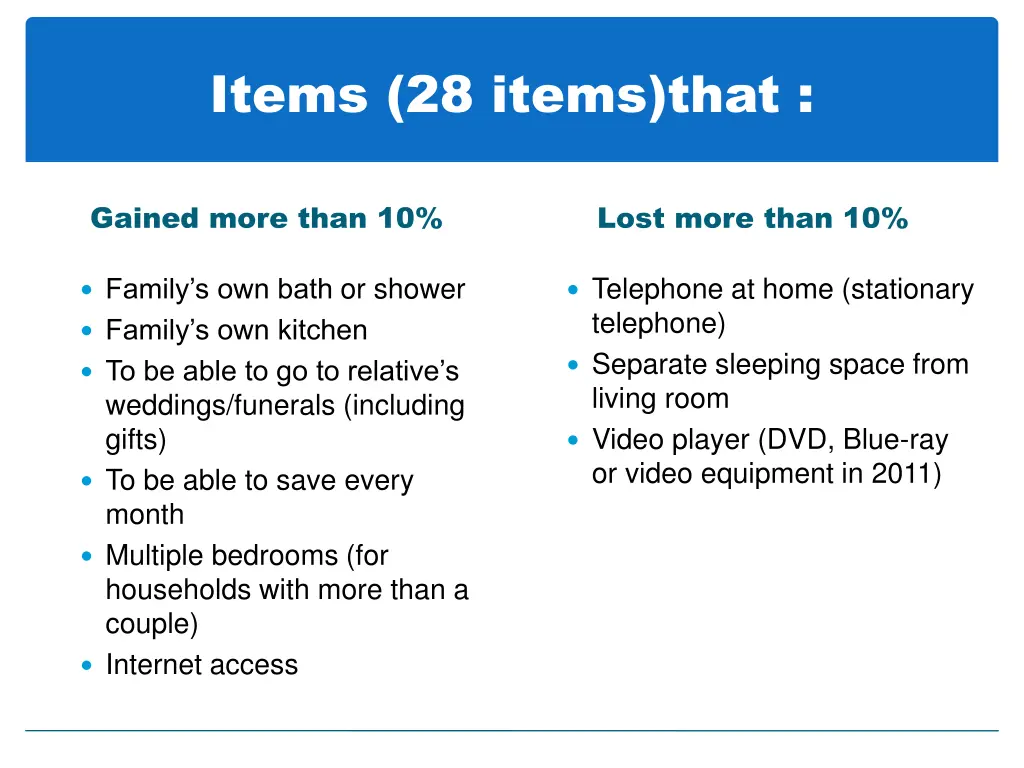
Items (28 items)that : Gained more than 10% Lost more than 10% Family’s own bath or shower Family’s own kitchen To be able to go to relative’s weddings/funerals (including gifts) To be able to save every month Multiple bedrooms (for households with more than a couple) Internet access Telephone at home (stationary telephone) Separate sleeping space from living room Video player (DVD, Blue-ray or video equipment in 2011)
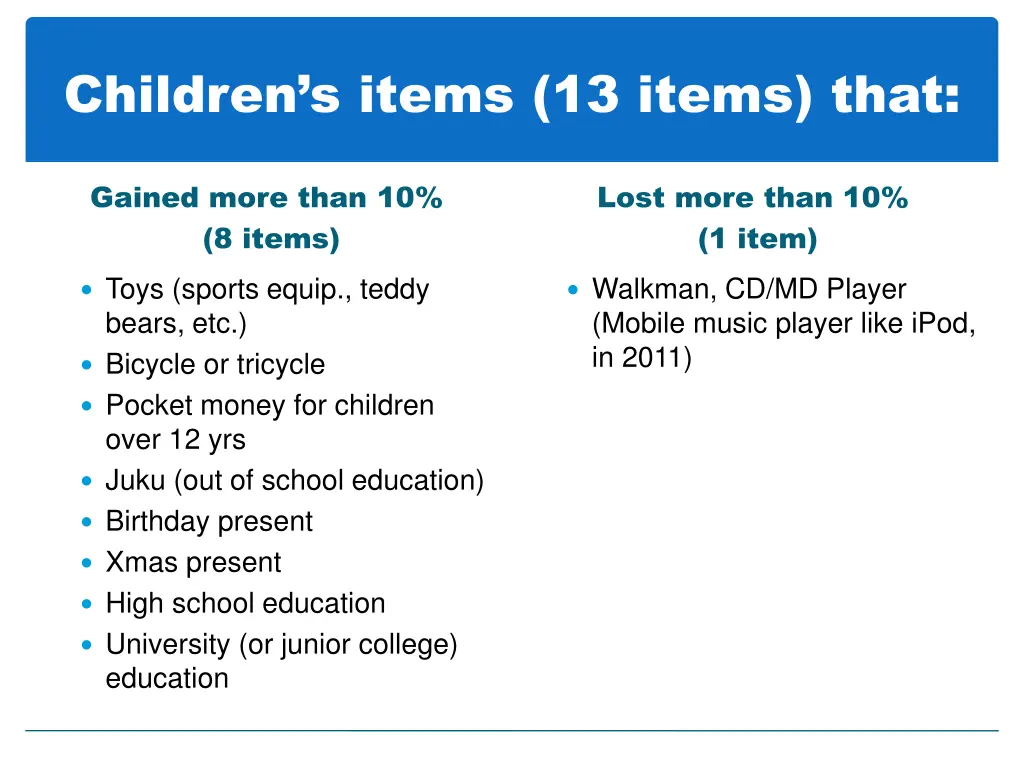
Children’s items (13 items) that: Gained more than 10% (8 items) Lost more than 10% (1 item) Toys (sports equip., teddy bears, etc.) Bicycle or tricycle Pocket money for children over 12 yrs Juku (out of school education) Birthday present Xmas present High school education University (or junior college) education Walkman, CD/MD Player (Mobile music player like iPod, in 2011)
Who changed opinion? Pick items with a lot of change. See by sub-groups.
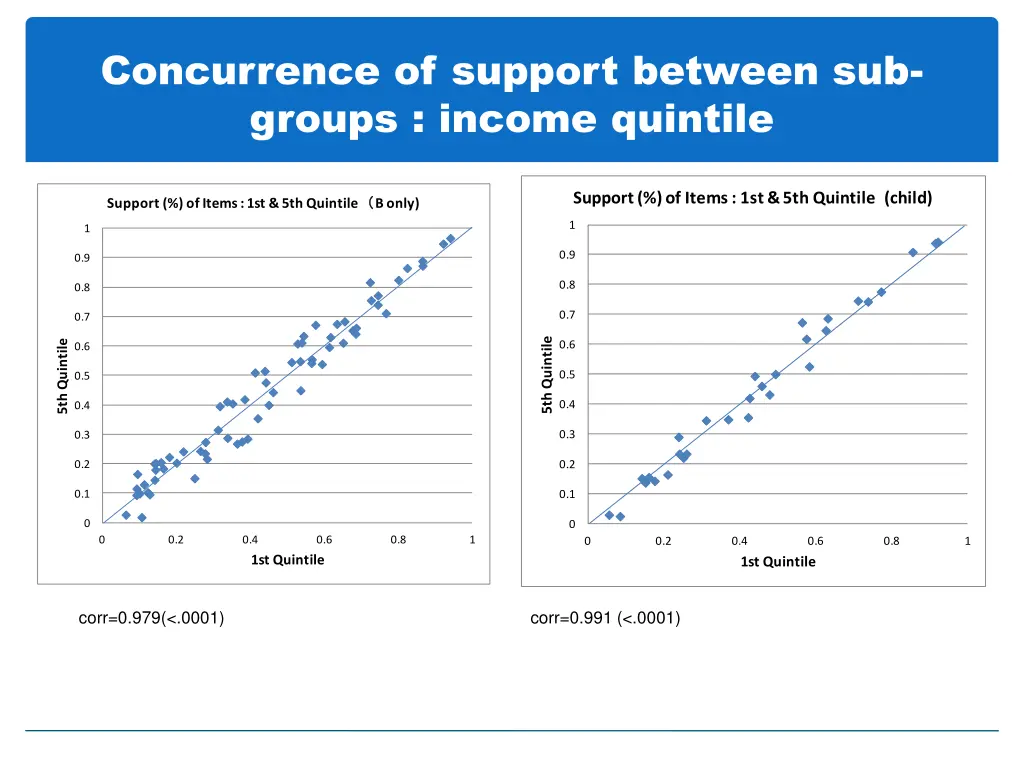
Concurrence of support between sub- groups : income quintile Support (%) of Items : 1st & 5th Quintile (child) Support (%) of Items : 1st & 5th Quintile ( (B only) 1 1 0.9 0.9 0.8 0.8 0.7 0.7 5th Quintile 5th Quintile 0.6 0.6 0.5 0.5 0.4 0.4 0.3 0.3 0.2 0.2 0.1 0.1 0 0 0 0.2 0.4 0.6 0.8 1 0 0.2 0.4 0.6 0.8 1 1st Quintile 1st Quintile corr=0.979(<.0001) corr=0.991 (<.0001)
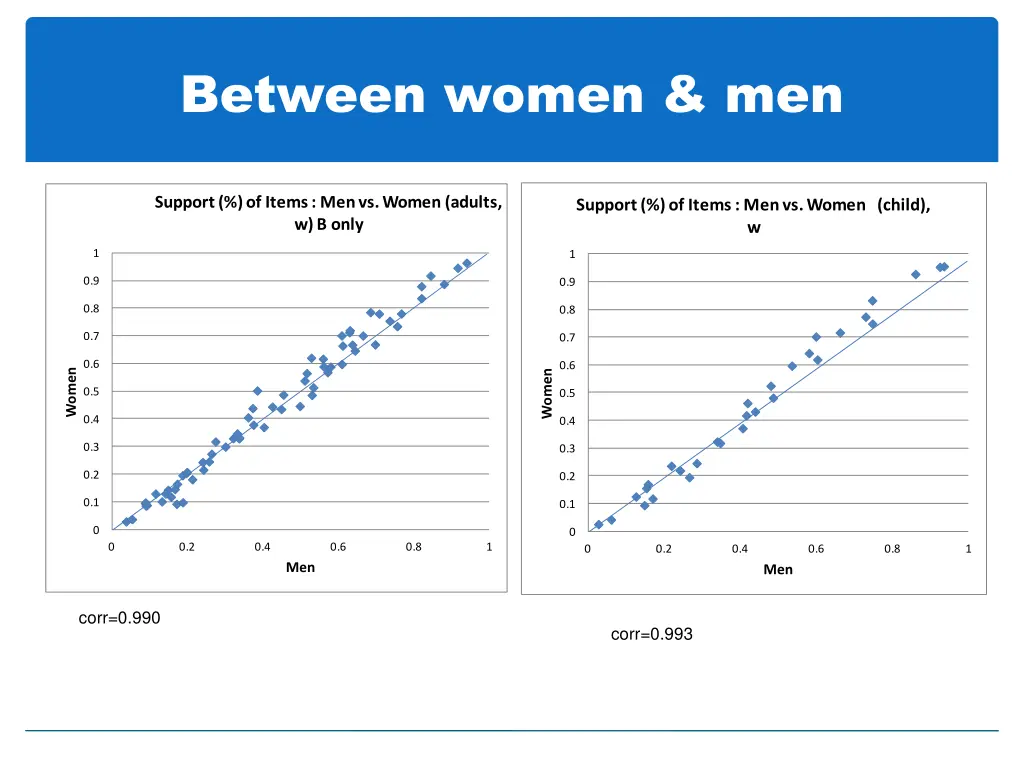
Between women & men Support (%) of Items : Men vs. Women (adults, w) B only Support (%) of Items : Men vs. Women (child), w 1 1 0.9 0.9 0.8 0.8 0.7 0.7 0.6 0.6 Women Women 0.5 0.5 0.4 0.4 0.3 0.3 0.2 0.2 0.1 0.1 0 0 0 0.2 0.4 0.6 0.8 1 0 0.2 0.4 0.6 0.8 1 Men Men corr=0.990 corr=0.993
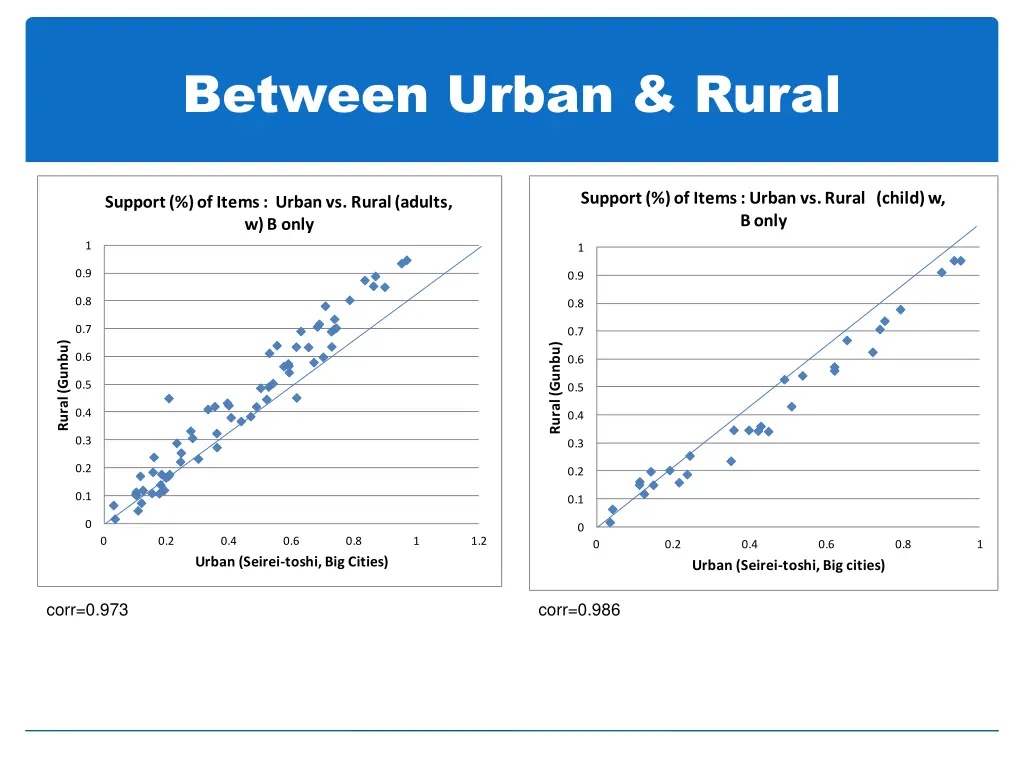
Between Urban & Rural Support (%) of Items : Urban vs. Rural (child) w, B only Support (%) of Items : Urban vs. Rural (adults, w) B only 1 1 0.9 0.9 0.8 0.8 0.7 0.7 Rural (Gunbu) Rural (Gunbu) 0.6 0.6 0.5 0.5 0.4 0.4 0.3 0.3 0.2 0.2 0.1 0.1 0 0 0 0.2 0.4 0.6 0.8 1 1.2 0 0.2 0.4 0.6 0.8 1 Urban (Seirei-toshi, Big Cities) Urban (Seirei-toshi, Big cities) corr=0.973 corr=0.986
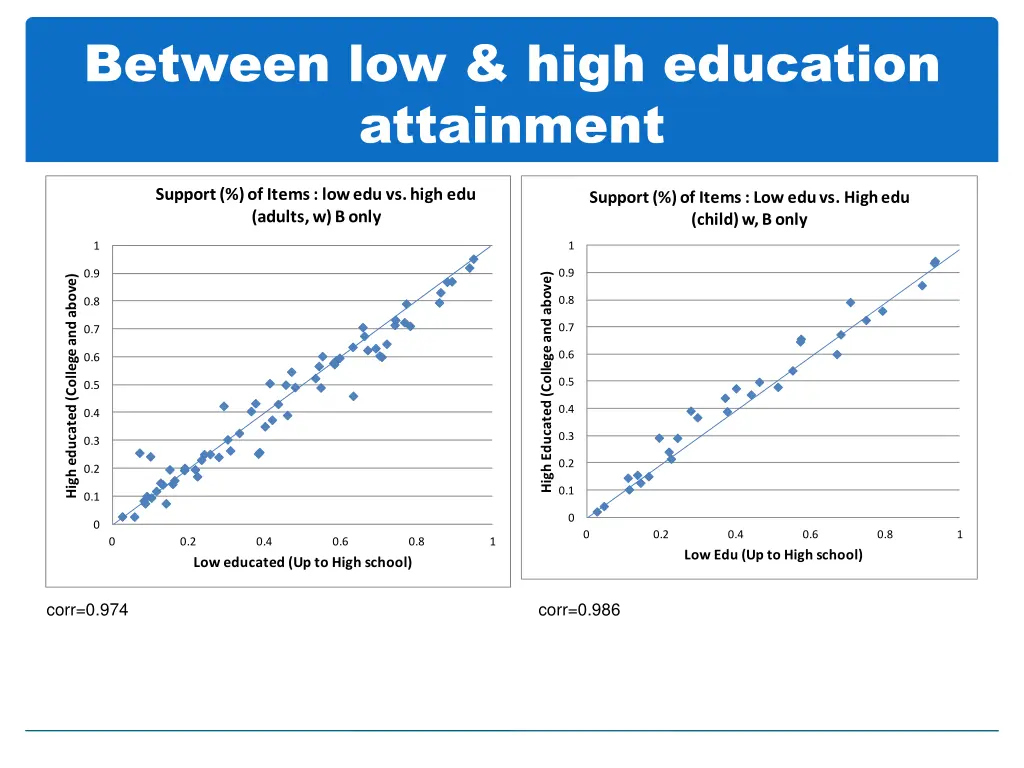
Between low & high education attainment Support (%) of Items : low edu vs. high edu (adults, w) B only Support (%) of Items : Low edu vs. High edu (child) w, B only 1 1 0.9 0.9 High Educated (College and above) High educated (College and above) 0.8 0.8 0.7 0.7 0.6 0.6 0.5 0.5 0.4 0.4 0.3 0.3 0.2 0.2 0.1 0.1 0 0 0 0.2 0.4 0.6 0.8 1 0 0.2 0.4 0.6 0.8 1 Low Edu (Up to High school) Low educated (Up to High school) corr=0.974 corr=0.986
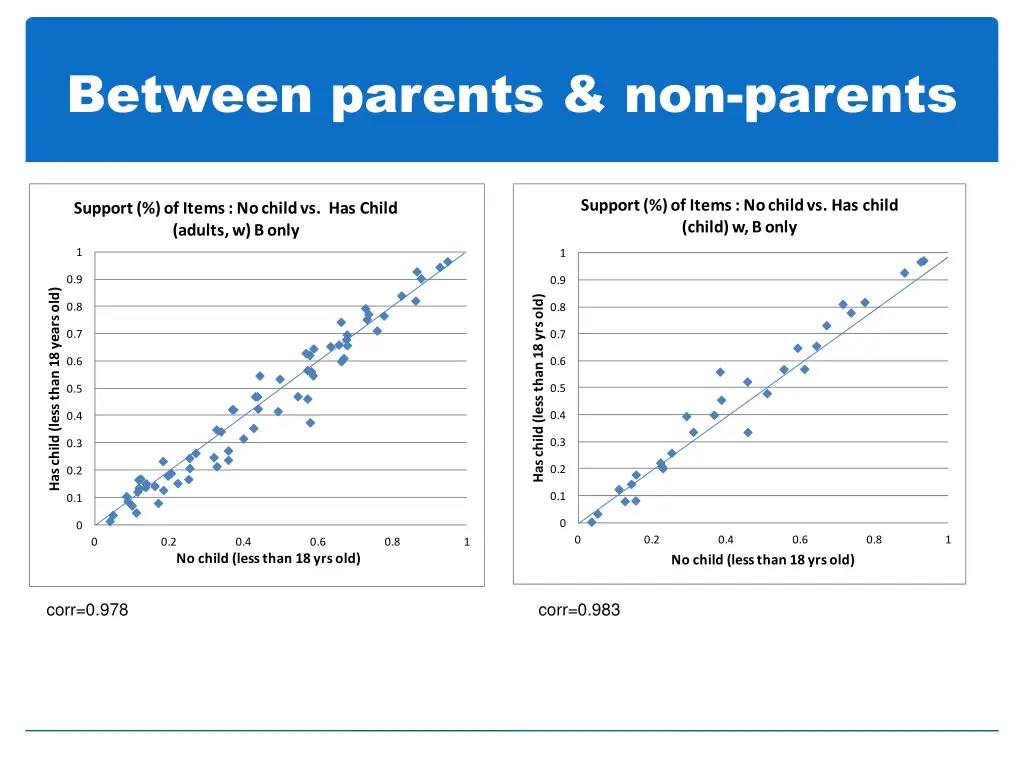
Between parents & non-parents Support (%) of Items : No child vs. Has child (child) w, B only Support (%) of Items : No child vs. Has Child (adults, w) B only 1 1 0.9 0.9 Has child (less than 18 years old) Has child (less than 18 yrs old) 0.8 0.8 0.7 0.7 0.6 0.6 0.5 0.5 0.4 0.4 0.3 0.3 0.2 0.2 0.1 0.1 0 0 0 0.2 0.4 0.6 0.8 1 0 0.2 0.4 0.6 0.8 1 No child (less than 18 yrs old) No child (less than 18 yrs old) corr=0.978 corr=0.983
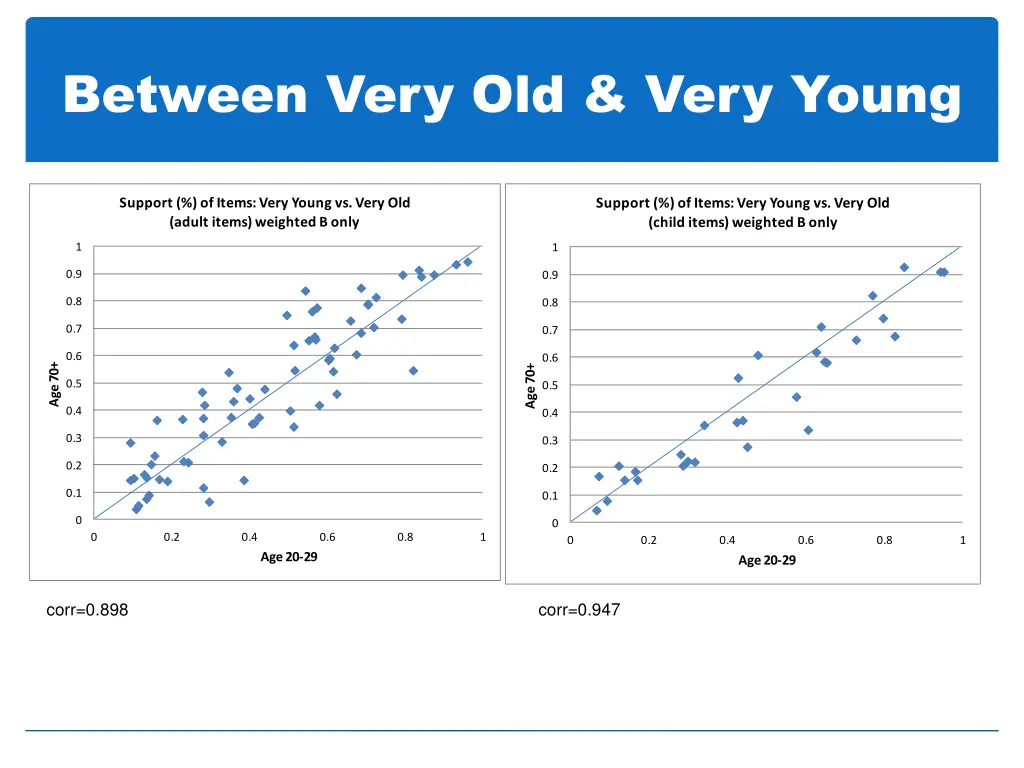
Between Very Old & Very Young Support (%) of Items: Very Young vs. Very Old (adult items) weighted B only Support (%) of Items: Very Young vs. Very Old (child items) weighted B only 1 1 0.9 0.9 0.8 0.8 0.7 0.7 0.6 0.6 Age 70+ Age 70+ 0.5 0.5 0.4 0.4 0.3 0.3 0.2 0.2 0.1 0.1 0 0 0 0.2 0.4 0.6 0.8 1 0 0.2 0.4 0.6 0.8 1 Age 20-29 Age 20-29 corr=0.898 corr=0.947
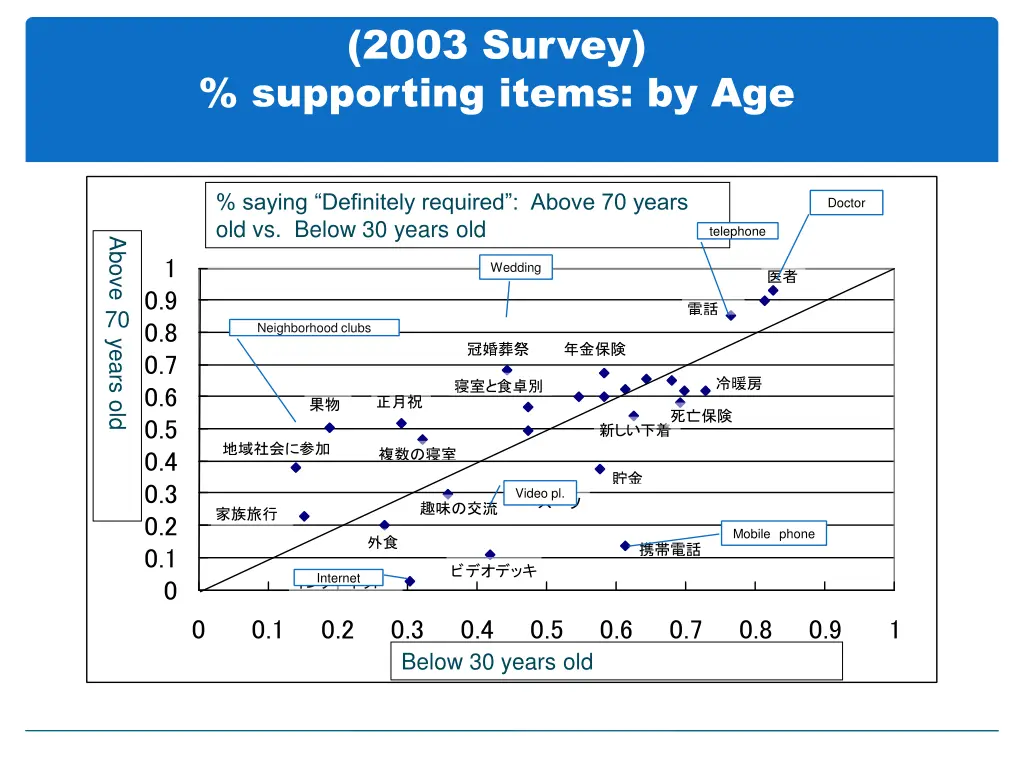
(2003 Survey) % supporting items: by Age % saying “Definitely required”: Above 70 years Doctor 図15 「絶対に必要」とする人の割合: 30歳未満vs. 70歳以上 old vs. Below 30 years old telephone Above 70 years old 1 Wedding 医者 0.9 電話 0.8 Neighborhood clubs 冠婚葬祭 年金保険 0.7 冷暖房 寝室と食卓別 0.6 70歳以上 正月祝 果物 死亡保険 0.5 新しい下着 地域社会に参加 複数の寝室 0.4 貯金 0.3 Video pl. スーツ 趣味の交流 家族旅行 0.2 Mobile phone 外食 携帯電話 0.1 ビデオデッキ Internet インターネット 0 0 0.1 0.2 0.3 Below 30 years old 0.4 0.5 0.6 0.7 0.8 0.9 1 30歳未満
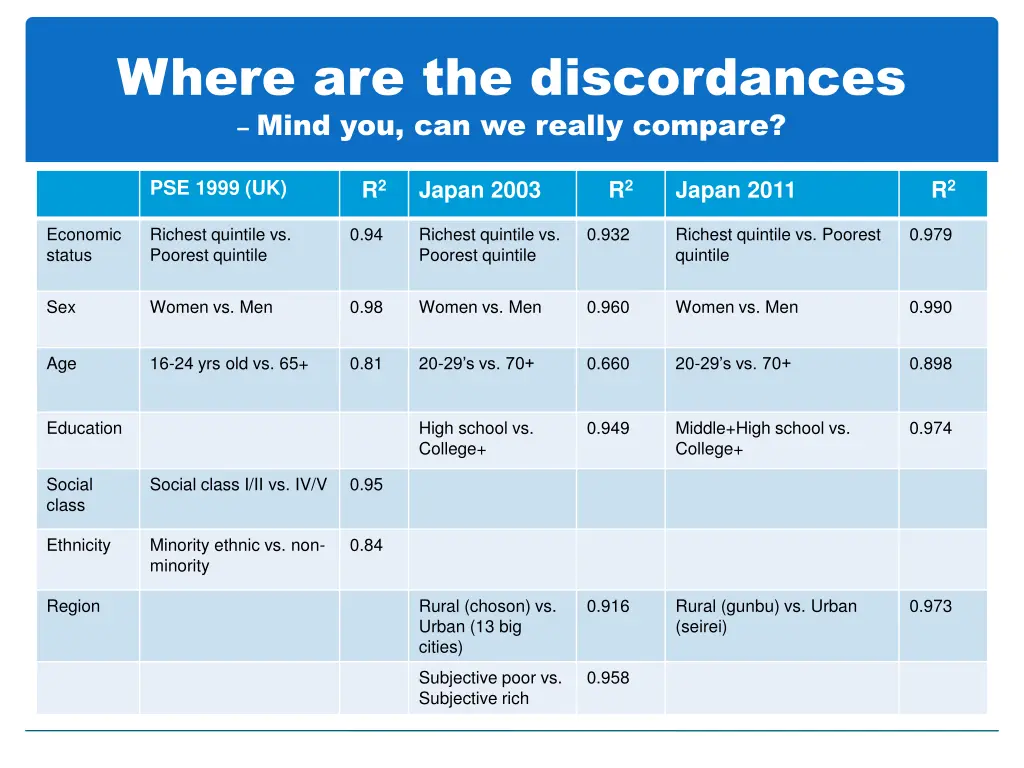
Where are the discordances – Mind you, can we really compare? PSE 1999 (UK) R2 Japan 2003 R2 Japan 2011 R2 Economic status Richest quintile vs. Poorest quintile 0.94 Richest quintile vs. Poorest quintile 0.932 Richest quintile vs. Poorest quintile 0.979 Sex Women vs. Men 0.98 Women vs. Men 0.960 Women vs. Men 0.990 Age 16-24 yrs old vs. 65+ 0.81 20-29’s vs. 70+ 0.660 20-29’s vs. 70+ 0.898 Education High school vs. College+ 0.949 Middle+High school vs. College+ 0.974 Social class Social class I/II vs. IV/V 0.95 Ethnicity Minority ethnic vs. non- minority 0.84 Region Rural (choson) vs. Urban (13 big cities) 0.916 Rural (gunbu) vs. Urban (seirei) 0.973 Subjective poor vs. Subjective rich 0.958