K-means Clustering Algorithm with Matlab Source code
Also Checkout: http://bit.ly/2Mub6xP

K-means Clustering Algorithm with Matlab Source code
E N D
Presentation Transcript
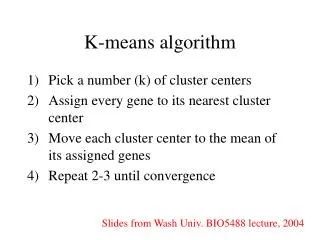
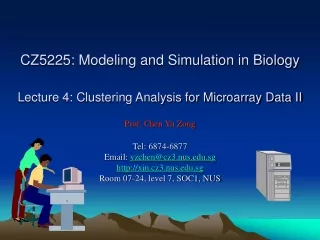
1 The K-means Clustering Algorithm K-means is a method of clustering observations into a specific number of disjoint clusters. The ”K” refers to the number of clusters specified. Various distance measures exist to deter- mine which observation is to be appended to which cluster. The algorithm aims at minimiz- ing the measure betweenthe centroideof theclusterand the givenobservationby iteratively appending an observation to any cluster and terminate when the lowest distance measure is achieved. 1.1 19.1 Overview Of Algorithm 1. The sample space is intially partitioned into K clusters and the observations are ran- domly assigned to the clusters. 2. For each sample: • Calculate the distance from the observation to the centroide of the cluster. • IF the sample is closest to its own cluster THEN leave it ELSE select another cluster. 3. Repeat steps 1 and 2 untill no observations are moved from one cluster to another When step 3 terminates the clusters are stable and each sample is assigned a cluster which results in the lowest possible distance to the centriode of the cluster. 19.2Distancemeasures Common distance measures include the Euclidean distance, the Euclidean squared distance and the Manhattan or City distance. The Euclidean measure corresponds to the shortest geometric distance between to points. s N ∑ i=1 (19.1) d = (xi−yi)2 1 http://bit.ly/2Mub6xP
CHAPTER19.THEK-MEANSCLUSTERINGALGORITHM A faster way of determining the distance is by use of the squared Euclidean distance which calculates the above distance squared, i.e. N ∑ i=1 (xi−yi)2 dsq= (19.2) The Manhattan measure calculates a distance between points based on a grid and is illus- tratedinFigure19.1. Euclidean measure Manhattan measure Figure19.1:ComparisionbetweentheEuclideanandtheManhattanmeasure. For applications in speech processing the squared Euclidean distance is widely used. 19.3ApplicationofK-means K-means can be used to cluster the extracted features from speech signals. The extracted features from the signal include for instance mel frequency cepstral coefficients or line spec- trum pairs. This allows speech signals with similar spectral characteristics to be positioned into the same position in the codebook. In this way similar narrow band signals will be predicted likewise thereby limiting the size of the codebook. 19.4ExampleofK-meansClustering The following figures illustrate the K-means algoritm on a 2-dimensional data set. 2 http://bit.ly/2Mub6xP
19.4.EXAMPLEOFK-MEANSCLUSTERING 20 15 10 5 0 −5 −10 −15 −20 −20 −15 −10 −5 0 5 10 15 20 Figure19.2:ExampleofsignaldatamadefromGaussianWhiteNoise. 20 15 10 5 0 −5 −10 −15 −20 −20 −15 −10 −5 0 5 10 15 20 Figure19.3:Thesignaldataareseperatedintosevenclusters.Thecentroidsare marked with a cross. 3 http://bit.ly/2Mub6xP
CHAPTER19.THEK-MEANSCLUSTERINGALGORITHM 1 2 3 Cluster 4 5 6 7 0 0.2 0.4 Silhouette Value 0.6 0.8 1 Figure19.4:TheSilhouettediagramshowshowwellthedataareseperated into the seven clusters. If the distance from one point to two centroids is the same, it means the point could belong to both centroids. The result is a conflict which gives a negative value in the Silhouette diagram. The positive part of the Silhuoette diagram, shows that there is a clear seperation of the points between the clusters. 4 http://bit.ly/2Mub6xP
19.5.MATLABSOURCECODE 19.5MatlabSourceCode 1 2 3 4 5 6 7 X = [10∗ randn(400 ,2) ; 10∗ randn(400 ,2) ] ; 8 plot (X(: ,1) ,X(: ,2) , ’k. ’ ) 9 length(X(: ,1) ) 10 figure 11 %i =1; 12 k=1; 13 for i =1: length (X(: ,1) ) 14 if ( sqrt (X( i ,1)^2+X( i ,2) ^2) ) > Limit ; 15 X( i ,1) =0; 16 X( i ,2) =0; 17 else 18 Y(k ,1)=X( i ,1) ; 19 Y(k ,2)=X( i ,2) ; 20 k=k+1; 21 end 22 end 23 plot (Y(: ,1) ,Y(: ,2) , ’k. ’ ) 24 figure 25 26 [ cidx , ctrs ] = kmeans(Y, 7 , ’ dist ’ , ’ sqEuclidean ’ , ’rep ’ ,5 , ’ disp ’ , ’ final ’ , ’EmptyAction ’ , ’ singleton ’ ) ; 27 28 plot (Y( cidx==1 ,1) ,Y( cidx==1 ,2) , ’ r . ’ , . . . 29 Y( cidx==2 ,1) ,Y( cidx==2 ,2) , ’b. ’ , ctrs (: ,1) , ctrs (: ,2) , ’kx ’ ) ; 30 31 hold on 32 plot (Y( cidx==3 ,1) ,Y( cidx==3 ,2) , ’y . ’ ,Y( cidx ==4 ,1) ,Y( cidx==4 ,2) , ’g . ’ ) ; 33 34 hold on 35 plot (Y( cidx==5 ,1) ,Y( cidx==5 ,2) , ’c . ’ ,Y( cidx ==6 ,1) ,Y( cidx==6 ,2) , ’m. ’ ) ; 36 37 hold on 38 plot (Y( cidx==7 ,1) ,Y( cidx==7 ,2) , ’k . ’ ) ; 39 40 figure close all clear all clc Limit = 20; 5 http://bit.ly/2Mub6xP
CHAPTER19.THEK-MEANSCLUSTERINGALGORITHM 41 42 mean( silk ) [ silk ,h]= silhouette (Y, cidx , ’ sqEuclidean ’ ) ; Data Science Course Content: Checkout: http://bit.ly/2Mub6xP 6