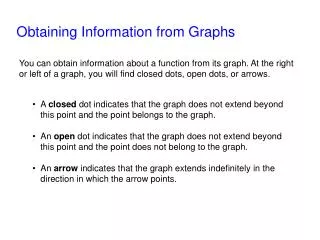
Download
1 / 80
800 likes | 834 Views
This information network explores the concepts of networks, graphs, and measurements, focusing on web networks. It discusses the importance of understanding network properties and provides an overview of real networks and random graph models. Additionally, it examines the role of networks in different fields such as social networks, knowledge networks, technological networks, and biological networks.

E N D
Information Networks - Web Graphs Thanks to: P. Tsaparas, P. Baldi, P. Frasconi, P. Smyth
Outline • Networks - motivation • Past and present • Real vs random • Review of graphs and measurements • Scale free - power laws • Web as a graph/network • Why important
What is a network? • Network: a collection of entities that are interconnected with links. • people that are friends • computers thatare interconnected • web pages that point to each other • proteins that interact
Graphs • In mathematics, networks are called graphs, the entities are nodes, and the links are edges • Graph theory starts in the 18th century, with Leonhard Euler • The problem of Königsberg bridges • Since then graphs have been studied extensively.
Networks in the past • Graphs have been used in the past to model existing networks (e.g., networks of highways, social networks) • usually these networks were small • network can be studied visual inspection can reveal a lot of information
Networks now • More and larger networks appear • Products of technological advancement • e.g., Internet, Web • Result of our ability to collect more, better, and more complex data • e.g., gene regulatory networks • Networks of thousands, millions, or billions of nodes • impossible to visualize
Understanding large graphs • What are the statistics of real life networks? • Can we explain how the networks were generated?
Measuring network properties • Around 1999 • Watts and Strogatz, Dynamics and small-world phenomenon • Faloutsos3, On power-law relationships of the Internet Topology • Kleinberg et al., The Web as a graph • Barabasi and Albert, The emergence of scaling in real networks
Real network properties • Most nodes have only a small number of neighbors (degree), but there are some nodes with very high degree (power-law degree distribution) • scale-free networks • If a node x is connected to y and z, then y and z are likely to be connected • high clustering coefficient • Most nodes are just a few edges away on average. • small world networks • Networks from very diverse areas (from internet to biological networks) have similar properties • Is it possible that there is a unifying underlying generative process?
Generating random graphs • Classic graph theory model (Erdös-Renyi) • each edge is generated independently with probability p • Very well studied model but: • most vertices have about the same degree • the probability of two nodes being linked is independent of whether they share a neighbor • the average paths are short
Modeling real networks • Real life networks are not “random” • Can we define a model that generates graphs with statistical properties similar to those in real life? • a flurry of models for random graphs
Processes on networks • Why is it important to understand the structure of networks? • Epidemiology: Viruses propagate much faster in scale-free networks • Vaccination of random nodes does not work, but targeted vaccination is very effective • Random sampling can be dangerous!
Web search • First generation search engines: the Web as a collection of documents • Suffered from spammers, poor, unstructured, unsupervised content, increase in Web size • Second generation search engines: the Web as a network • use the anchor text of links for annotation • good pages should be pointed to by many pages • good pages should be pointed to by many good pages • PageRank algorithm, Google! • Hits (hubs and authorities) • Most search engines ranking methods
The future of networks • Networks seem to be here to stay • More and more systems are modeled as networks • Scientists from various disciplines are working on networks (physicists, computer scientists, mathematicians, biologists, sociologist, economists) • There are many questions to understand.
Mathematical Tools • Graph theory • Probability theory • Linear Algebra
Types of networks • Social networks • Knowledge (Information) networks • Technology networks • Biological networks
Social Networks • Links denote a social interaction • Networks of acquaintances • collaboration networks • actor networks • co-authorship networks • director networks • phone-call networks • e-mail networks • IM networks • Bluetooth networks • sexual networks • home page/blog networks
Knowledge (Information) Networks • Nodes store information, links associate information • Citation network (directed acyclic) • The Web (directed) • Peer-to-Peer networks • Word networks • Networks of Trust • Software graphs
Technological networks • Networks built for distribution of commodity • The Internet • router level, AS level • Power Grids • Airline networks • Telephone networks • Transportation Networks • roads, railways, pedestrian traffic
Biological networks • Biological systems represented as networks • Protein-Protein Interaction Networks • Gene regulation networks • Gene co-expression networks • Metabolic pathways • The Food Web • Neural Networks
Measuring Networks • Degree distributions • Small world phenomena • Clustering Coefficient • Mixing patterns • Degree correlations • Communities and clusters
The basic random graph model • The measurements on real networks are usually compared against those on “random networks” • The basic Gn,p(Erdös-Renyi) random graph model: • n : the number of vertices • 0 ≤ p ≤ 1 • for each pair (i,j), generate the edge (i,j)independently with probability p
Degree distributions • Problem: find the probability distribution that best fits the observed data frequency fk = fraction of nodes with degree k = probability of a randomly selected node to have degree k fk k degree
Power-law distributions • The degree distributions of most real-life networks follow a power law • Right-skewed/Heavy-tail distribution • there is a non-negligible fraction of nodes that has very high degree (hubs) • scale-free: no characteristic scale, average is not informative • In stark contrast with the random graph model! • Poisson degree distribution, z=np • highly concentrated around the mean • the probability of very high degree nodes is exponentially small p(k) = Ck-a
Power-law signature • Power-law distribution gives a line in the log-log plot • a : power-law exponent (typically 2 ≤ a≤ 3) log p(k) = -a logk + logC α log frequency frequency log degree degree
Examples of degree distribution for power laws Taken from [Newman 2003]
Exponential distribution • Observed in some technological or collaboration networks • Identified by a line in the log-linear plot p(k) = le-lk log p(k) = - lk + log l log frequency λ degree
Average/Expected degree • For random graphs z = np • Forpower-law distributed degree • if a ≥ 2, it is a constant • if a < 2, it diverges
Maximum degree • For random graphs, the maximum degree is highly concentrated around the average degree z • For power law graphs
Clustering (Transitivity) coefficient • Measures the density of triangles (local clusters) in the graph • Two different ways to measure it: • The ratio of the means
Example 1 4 3 2 5
Clustering (Transitivity) coefficient • Clustering coefficient for node i • The mean of the ratios
Example • The two clustering coefficients give different measures • C(2) increases with nodes with low degree 1 4 3 2 5
Clustering coefficient for random graphs • The probability of two of your neighbors also being neighbors is p, independent of local structure • clustering coefficient C = p • when z is fixed C = z/n =O(1/n)
The C(k) distribution • The C(k) distribution is supposed to capture the hierarchical nature of the network • when constant: no hierarchy • when power-law: hierarchy C(k) = average clustering coefficient of nodes with degree k C(k) k degree
Millgram’s small world experiment • Letters were handed out to people in Nebraska to be sent to a target in Boston • People were instructed to pass on the letters to someone they knew on first-name basis • The letters that reached the destination followed paths of length around 6 • Six degrees of separation:(play of John Guare) • Also: • The Kevin Bacon game • The Erdös number • Small world project: http://smallworld.columbia.edu/index.html
Measuring the small world phenomenon • dij = shortest path between i and j • Diameter: • Characteristic path length: • Harmonic mean • Also, distribution of all shortest paths
Is the path length enough? • Random graphs have diameter • d=logn/loglogn when z=ω(logn) • Short paths should be combined with other properties • ease of navigation • high clustering coefficient
Degree correlations • Do high degree nodes tend to link to high degree nodes? • Pastor Satoras et al. • plot the mean degree of the neighbors as a function of the degree
Degree correlations • Newman • compute the correlation coefficient of the degrees of the two endpoints of an edge • assortative/disassortative
Connected components • For undirected graphs, the size and distribution of the connected components • is there a giant component? • For directed graphs, the size and distribution of strongly and weakly connected components
Network Resilience • Study how the graph properties change when performing random or targeted node deletions
The history of the Web Vannevar Bush – “As we may think” (1945) The “MEMEX”: A photo-electrical-mechanical device that stores documents and images and allows to create and follow links between them
The history of the Web Tim Berners-Lee 1980 – CERN: Writes a notebook program “Enquire-upon-within-everything” that allows links to be made between arbitrary nodes 1989 – CERN: Circulates the document “Information management: a proposal” 1990 – CERN: The first Web browser, and the first Web server-client communication 1994 : The creation of the WWW consortium (W3C)