Download
1 / 21
210 likes | 226 Views
Explore the contrast between fossil and contemporary carbon at 12 rural and urban sites across the United States. Investigate organic carbon variations and seasonal trends. Analyze data from monitoring networks for insights into carbon sources and composition.

E N D
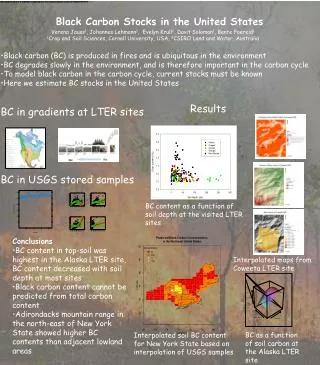
Fossil vs Contemporary Carbon at 12 Rural and Urban Sites in the United States Bret A. Schichtel (NPS) William C. Malm (NPS) Graham Bench (LLNL) Charles E. McDade (UCD) Judy C. Chow (DRI) John Watson (DRI)
Urban & Rural Annual Organic Carbon IMPROVE – Rural sites STN – Urban/suburban sites Speciated PM2.5 monitoring networks:
Carbon Isotope (14C/12C) Network PugetSound Sula Proctor Maple Mt.Rainier Brigantine Lake Sugema Rocky Mt. Yosemite Grand Canyon Great Smoky Mt. Phoenix Tonto Summer: Jun – Aug ‘04; Winter: Dec ’04 – Feb ‘05 Summer: Jun – Aug ‘05; Winter: Dec ’05 – Feb ‘06 Summer: Jul – Aug ‘02 Six day HI-VOL PM2.5 samples
Contemporary (Biogenic) Vs Fossil Carbon • C14 half life ~5700 yr • fM = 0 for fossil C • fM ~ 1.08 for biogenic C • Fraction Contemporary = fM/1.08 • Samples corrected for positive organic artifact on filters Summer 2004
Seasonal Contemporary and Fossil C (mg/m3) The error bars represent the range in six day concentrations
Seasonal Fraction Contemporary Carbon The error bars represent the fraction contemporary range
Urban Excess Puget Sound, WA (Blue) – Mt. Rainier, WA (Red) • Puget Sound fossil carbon is primarily due to local sources during winter and summer • Summer biogenic carbon is regionally distributed • ~40% of the winter urban excess is biogenic carbon • Not all biogenic carbon is “natural” Puget Sound Mt Rainier
Urban ExcessPhoenix, AZ (Blue) – Tonto, AZ (Red) • Phoenix fossil carbon is primarily due to local sources during winter and summer • Summer biogenic carbon is regionally distributed • About half of the winter urban excess is biogenic carbon • Not all biogenic carbon is “natural” Phoenix Tonto
IMPROVE Fine Particulate Carbon • All monitors were collocated with IMPROVE monitors measuring OC and EC using thermal optical reflectance (TOR) • IMPROVE collects 24-hour PM2.5 samples every third day Total Carbon: Summer Total Carbon: Winter • On average HiVol total carbon was 10-20% greater than IMPROVE
Fraction Biogenic Vs EC/TC 6-Day Averages • Summer EC/TC • Fossil ~ 0.36 • Biogenic ~ 0.12 • Winter EC/TC • Fossil ~ 0.45 • Biogenic ~ 0.19 • Winter/Summer • Fossil: 1.25 • Biogenic: 1.58 Seasonal Averages
EC/TC Ratios from IMPROVE Data Edge Analysis • Rural 10th %-ile edge ~ Biogenic EC/TC • Summer – 0.07 • Winter – 0.16 • Urban 90th %-ile edge ~ Fossil EC/TC • Summer – 0.41 • Winter – 0.44
Measured Primary EC/TC Ratios • Mobile Sources – Fossil Carbon • Adjusted Roadside: EC/TC = 0.39 (Chow et al., 2004) • 1996 Sepulveda. CA tunnel study: EC/TC = 0.57 (Gillies et al., 2001) • Light duty vehicle: EC/TC = 0.3 (Cadle et al., 1997) • Heavy Duty Diesel: EC/TC = 0.63 (Lowenthal et al. 1994) • Wood Smoke – Biogenic Carbon (McDonald et al., 2000) • Softwood in fireplace: EC/TC = 0.2 • Hardwood in fireplace: EC/TC = 0.1 • Hardwood in woodstove: EC/TC = 0.11 • Texas grass and soft and hardwood: EC/TC = 0.2 (Chow et al., 2004) • Cooking • EC/TC = 0.1 (Chow et al., 2004) • Secondary organic aerosol • EC/TC = 0
Comparison of EC/TC estimates • Projected fossil and biogenic EC/TC ratios are in line with other estimates • Summer Fossil EC/TC ratio is on low side • Literature summer EC/TC higher than C 12/14 and EC/TC edge analyses • Literature examined primary aerosol • Fossil and Biogenic EC/TC is smaller in the summer than the winter indicating some summertime SOA formation for both
Fraction Biogenic - Summer 2004-05 The summer (June-August) IMPROVE carbon data were partitioned into fossil and biogenic carbon using the derived fossil and biogenic EC/TC ratios
Fraction Biogenic - Winter 2004-06 The summer (December - February) IMPROVE carbon data were partitioned into fossil and biogenic carbon using the derived fossil and biogenic EC/TC ratios
Estimating Secondary Organic Carbon (SOC) • Assume: • All elemental carbon is primary • Winter organic carbon is primary (PC) • Summer organic carbon is primary + secondary
Fraction Secondary Organic Carbon for Summer Months • 42% of the summertime organic carbon is secondary • 32% of the summertime fossil carbon is secondary • If some winter organic carbon is secondary than these summer SOC contributions are lower bounds
Summary • Biogenic carbon accounts for • 80-95% of the total carbon at the rural sites • 70-80% of total carbon at near urban sites • 50% of total carbon at urban sites • Little seasonality and total variation in fraction modern carbon • Urban fossil carbon is primarily due to local sources during the winter and summer • Summer biogenic carbon is regionally distributed • 40-50% of the winter urban excess is biogenic carbon • Not all biogenic carbon is “natural”
Summary • 42% or more of the summertime organic carbon is secondary • 32% or more of the summertime fossil carbon is secondary