
Immune Cell Response Analysis After Treatment: Examining NKG2A, CD94, and NK Receptors
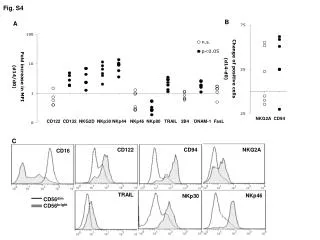
This study analyzes changes in positive immune cells from day 0 to day 14 post-treatment. It investigates the fold increase in Mean Fluorescence Intensity (MFI) of specific markers like NKG2A, CD94, CD122, and CD132, along with the expression levels of NKG2D, NKp30, NKp44, NKp46, NKp80, TRAIL, 2B4, DNAM-1, and FasL. The study evaluates the correlations between MFI changes and the expression of immune markers, including CD122, CD94, NKG2A, CD16, TRAIL, NKp46, NKp30, CD56dim, and CD56bright. The findings provide insight into the immune response dynamics post-treatment.

Immune Cell Response Analysis After Treatment: Examining NKG2A, CD94, and NK Receptors
E N D
Presentation Transcript
Fig. S4 B A Change of positive cells (d14-d0) Fold increase in MFI (d14/d0) NKG2A CD94 CD122 CD132 NKG2D NKp30 NKp44 NKp46 NKp80 TRAIL 2B4 DNAM-1 FasL C CD122 CD94 NKG2A CD16 TRAIL NKp46 NKp30 CD56dim CD56bright