Download
1 / 35
350 likes | 608 Views
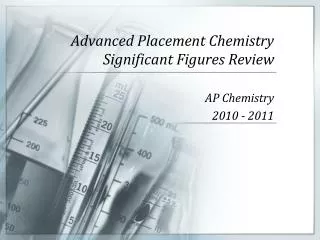
Advanced Placement Chemistry Significant Figures Review. AP Chemistry 2010 - 2011. Significant Figures. When we use equipment to measure quantities, we are limited in our ability to report an accurate value of the measurement by the precision of the equipment used to measure the quantity.

E N D
Advanced Placement Chemistry Significant Figures Review AP Chemistry 2010 - 2011
Significant Figures When we use equipment to measure quantities, we are limited in our ability to report an accurate value of the measurement by the precision of the equipment used to measure the quantity. When we report measurements, we want the presented values to have the precision that is possible but not more than is possible or reasonable. Thus, we apply rules for reading equipment and using those measurements in our calculations and reported data (answers).
Significant Figures For example, look at the burette at right. It is marked in 1 mL increments. Because the burette is marked in 1 mL increments, we can easily read the volume to these markings. Consider that the volume is at the level shown and the burette was initially at the zero mark. What certainvolume of solution has been used? 14 mL
Significant Figures Although we know for certain that the volume used is 14 mL, we really know that the volume used is between 14 and 15 mL. So, we estimate one additional digit beyond those that are known for certain. Here, we estimate the 0.10 mL value because we know the 1 mL value with certainty. What estimated volume of liquid has been used? 14.xmL
Significant Figures We report measurements to one additional digit beyond those that are know for certain – these are termed the significant figures of the measurement. We do not report beyond one estimated digit because the estimated digit is just that – estimated; to increase the precision beyond an estimated digit would add no usefulness to the measurement. In fact, it would report false information by implying that we know the value to a greater precision than that which is actually known. For example, we would not report the volume in the previous example to 14.557839200 mL, as this implies much more precision than what is really available to us.
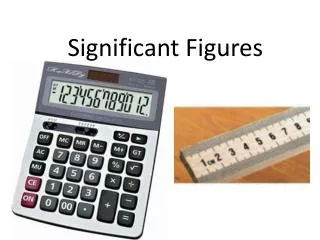
Significant Figures In essence, we report data to one place beyond the place in which the equipment is marked. So, for a burette marked to the ‘ones’ place, we report to the ‘tenths’ place. For a pipette marked to the ‘tenths’ place, we would estimate the ‘hundredths’ place. Typical laboratory equipment that we use will require estimation to 0.10 or 0.01. Digital equipment is programmed to estimate the last digit – do not try to estimate beyond those that are shown on the display.
Significant Figures When reading data, how many significant figures are present? All non-zero digits are significant. This measurement has 3 significant figures. 27.6 mL
Significant Figures When reading data, how many significant figures are present? Zeros between non-zero digits are significant. This measurement has 4 significant figures. 27.06 mL
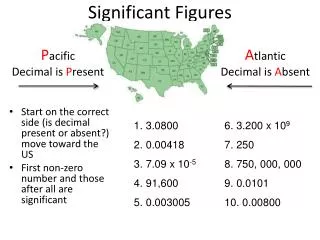
Significant Figures When reading data, how many significant figures are present? Zeros are also significant when a decimal point is present and the zeros are to the right of a non-zero digit. (Ask, “Is this zero a placeholder or does it add precision to the measured value?”) This measurement has 3 significant figures. 0.275 mL
Significant Figures When reading data, how many significant figures are present? Zeros are also significant when a decimal point is present and the zeros are to the right of a non-zero digit. (Ask, “Is this zero a placeholder or does it add precision to the measured value?”) This measurement has 3 significant figures. 0.0275 mL
Significant Figures When reading data, how many significant figures are present? Zeros are also significant when a decimal point is present and the zeros are to the right of a non-zero digit. (Ask, “Is this zero a placeholder or does it add precision to the measured value?”) This measurement has 3 significant figures. 0.00275 mL
Significant Figures When reading data, how many significant figures are present? Zeros are also significant when a decimal point is present and the zeros are to the right of a non-zero digit. (Ask, “Is this zero a placeholder or does it add precision to the measured value?”) This measurement has 4 significant figures. 0.2750 mL
Significant Figures When reading data, how many significant figures are present? Zeros are also significant when a decimal point is present and the zeros are to the right of a non-zero digit. (Ask, “Is this zero a placeholder or does it add precision to the measured value?”) This measurement has 4 significant figures. 0.02750 mL
Significant Figures When reading data, how many significant figures are present? Zeros are also significant when a decimal point is present and the zeros are to the right of a non-zero digit. (Ask, “Is this zero a placeholder or does it add precision to the measured value?”) This measurement has 1 significant figure. 200 mL
Significant Figures When reading data, how many significant figures are present? Zeros are also significant when a decimal point is present and the zeros are to the right of a non-zero digit. (Ask, “Is this zero a placeholder or does it add precision to the measured value?”) This measurement has 1 significant figure. 2000 mL
Significant Figures When reading data, how many significant figures are present? Zeros are also significant when a decimal point is present and the zeros are to the right of a non-zero digit. (Ask, “Is this zero a placeholder or does it add precision to the measured value?”) This measurement has 4 significant figures. 200.0 mL
Significant Figures When reading data, how many significant figures are present? Defined and counted values have an infinite number of significant digits and are not used in determining the overall precision of a reported value. This defined value has INFINITE significant figures. 12”, 12.0”, 12.00” equals 1 foot
Significant Figures When reading data, how many significant figures are present? Defined and counted values have an infinite number of significant digits and are not used in determining the overall precision of a reported value. These counted values have INFINITE significant figures. 16 students, 1230 books
Significant Figures Practice: Indicate the number of significant figures in the following values. 0.056 cm 0.111 g 3.045 x 10³ lbs 2 3 4 1.34 meters 0.0500 hours 4.5 x 10⁻⁴ grams 3 3 2 6.54 g 5260 feet in a mile 6.022 x 10²³ atoms 3 infinite 4 125.05 grams 2.54 cm 60 minutes in 1 hour 5 3 infinite 15.9994 grams 0. 0540 cm3 1.0 x 10² grams 6 3 2
Significant Figures When calculating with data, how do we represent an answer? When adding or subtracting values, we report the answer to contain a number of DECIMAL places equal to the term with the fewest used to obtain the answer. 12.2 mL + 15.64 mL = 27.84 mL (“calculator value”)
Significant Figures When calculating with data, how do we represent an answer? When adding or subtracting values, we report the answer to contain a number of DECIMAL places equal to the term with the fewest used to obtain the answer. 12.2 mL + 15.64 mL = 27.8 mL (“reported value”)
Significant Figures When calculating with data, how do we represent an answer? When adding or subtracting values, we report the answer to contain a number of DECIMAL places equal to the term with the fewest used to obtain the answer. 12.43 mL – 15.9 mL = –3.47 mL (“calculator value”)
Significant Figures When calculating with data, how do we represent an answer? When adding or subtracting values, we report the answer to contain a number of DECIMAL places equal to the term with the fewest used to obtain the answer. 12.43 mL – 15.9 mL = –3.5 mL (“reported value”)
Significant Figures When calculating with data, how do we represent an answer? When multiplying or dividing values, we report the answer to contain a number of significant figures equal to the term with the fewest used to obtain the answer. 2.500 g ÷ 120 mL = 0.02083 g/mL (“calculator value”)
Significant Figures When calculating with data, how do we represent an answer? When multiplying or dividing values, we report the answer to contain a number of significant figures equal to the term with the fewest used to obtain the answer. 2.500 g ÷ 120 mL = 0.021 g/mL (“reported value”)
Significant Figures When calculating with data, how do we represent an answer? When multiplying or dividing values, we report the answer to contain a number of significant figures equal to the term with the fewest used to obtain the answer. 6.904 g · 4 watch glasses = 27.616 g (“calculator value”)
Significant Figures When calculating with data, how do we represent an answer? When multiplying or dividing values, we report the answer to contain a number of significant figures equal to the term with the fewest used to obtain the answer. 6.904 g · 4 watch glasses = 27.62 g (“reported value”)
Significant Figures When calculating with data, how do we represent an answer? Rounding: consider only the digit that follows the digit to be retained; round up if it is 5 or greater, round down if it is less than 5. 3.450483 mL (4 sig figs) 3.450 mL
Significant Figures When calculating with data, how do we represent an answer? Rounding: consider only the digit that follows the digit to be retained; round up if it is 5 or greater, round down if it is less than 5. 3.450483 mL (5 sig figs) 3.4505 mL
Significant Figures When calculating with data, how do we represent an answer? Rounding: consider only the digit that follows the digit to be retained; round up if it is 5 or greater, round down if it is less than 5. 207 mL (2 sig figs) 210 mL
Significant Figures When calculating with data, how do we represent an answer? Sometimes, we can only represent data to the correct number of sig figs if we use scientific notation. 100 mL (2 sig figs) 1.0 · 102mL
Significant Figures When calculating with data, how do we represent an answer? Sometimes, we can only represent data to the correct number of sig figs if we include trailing zeros and a decimal point. 100 mL (3 sig figs) 100. mL
Significant Figures Practice: Perform the following calculations to the correct number of sig figs 0.05 g + 1.04 g 0.05 – 1.04 g 1.09 g –0.99 g 0.05 g + 1.0 g 0.05 g – 1.0 g 1.1 g –1.0 g 100.0 grams + 10.0 grams 0. 05 g + 3.222 g 110.0 g 3.27 g 5.1 kg + 3.672 kg 6.0944 g + 32.998 g + 22.989 g 8.8 kg 62.081 g
Significant Figures Practice: Perform the following calculations to the correct number of sig figs Assume all are measured values unless otherwise indicated 6.345 x 0.0025 3.250 ÷ 200 0.016 0.02 2.50 · 102 x 100 20 x 20 3 x 10⁴ 400 20 x 20. 20. x 20. 400 4.0 x 10² 20.0 x 20.0 20.00 x 20.00 400. 400.0 19.55 days converted to hours molar mass of PbCO3 469.2 hours 267.2 g
Significant Figures The following items in your textbook will provide additional practice: 1.37 to 1.42 You can also try the Skill Activity on this topic online: AP Chemistry Skill Activities Significant Figures