Download
1 / 34
340 likes | 610 Views
Part 3 Module 4 Probability of disjunctions, complements, and conditional probability. According to a recent article from the New England Journal of Medical Stuff , 63% of cowboys suffer from saddle sores, 52% of cowboys suffer from bowed legs, and

E N D
Part 3 Module 4 Probability of disjunctions, complements, and conditional probability
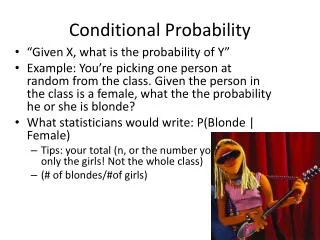
According to a recent article from the New England Journal of Medical Stuff, 63% of cowboys suffer from saddle sores, 52% of cowboys suffer from bowed legs, and 40% suffer from both saddle sores and bowed legs. What is the probability that a randomly selected cowboy has saddle sores or bowed legs? Note that these two events are not mutually exclusive. A. 1.15 B. .35 C. .75 D. None of these Exercise #1
According to a recent article from the New England Journal of Medical Stuff , 63% of cowboys suffer from saddle sores, 52% of cowboys suffer from bowed legs, and 40% suffer from both saddle sores and bowed legs. What is the probability that a randomly selected cowboy has saddle sores or bowed legs? When a counting problem or probability problem presents a population in terms of overlapping categories, we use a Venn diagram to organize the information. In this case, the numbers in the diagram are percents. The diagram shows the following: P(SS or BL) = 23% + 12% + 40% = 75% = .75 Solution #1
An alternative way to answer the previous question is by applying this special formula for the probability of the disjunction of events: For any events E, F, P(E or F) = P(E) + P(F) – P(E and F) Note that in the previous example, P(SS) = .63, P(BL) = .52, P(SS and BL) = .40. This data was presented at the beginning of the problem. So, without having to draw a Venn diagram, we have P(SS or BL) = P(SS) + P(BL) – P(SS and BL) = .63 + .52 – .40 = .75 A special formula
There are a couple of things to be said about this special formula. Recall that in Part 3 Module 3 we saw that if E, F are mutually exclusive, then P(E or F) = P(E) + P(F) The new formula contains this formula from Part 3 Module 3 as a special case, because, if the events are mutually exclusive, then the third term, P(E and F), is zero, and so disappears. The advantage to using this formula is that it allows us to avoid having to draw the Venn diagram, if the data is in percent form, and the event is a disjunction. Generally, drawing the Venn diagram is a good activity, because there are other questions for which the diagram is helpful. P(E or F) = P(E) + P(F) – P(E and F)
www.math.fsu.edu/~wooland/prob1/prob0.html Among a certain group of Vikings, 11 of them like to pillage, 12 of them like to plunder, while 6 of them like to pillage and like to plunder and 18 of them don't like to pillage and don't like to plunder. If one of these Vikings is randomly selected, find the probability that he/she likes to pillage or likes to plunder. Round to four decimal places. A. 0.4857 B. 0.3143 C. 0.1700 D. None of these. Exercise #2
Among a certain group of Vikings, 11 of them like to pillage, 12 of them like to plunder, while 6 of them like to pillage and like to plunder and 18 of them don't like to pillage and don't like to plunder. If one of these Vikings is randomly selected, find the probability that he/she likes to pillage or likes to plunder. We use a Venn diagram to organize the information. In this case, the data is NOT in percent form. The diagram shows that the total number of Vikings is 5+6+6+18 = 35 The number who like to pillage, or plunder, or both, is 5+6+6 = 17 So, P(pillage or plunder) = 17/35 = .4857 Solution #2
Referring to the answer to the previous question: If the probably that a randomly selected Viking like to pillage or plunder is .4857, what is the probability that a randomly selected Viking doesn’t like to pillage and doesn’t like to plunder? Solution The Venn diagram shows that the answer is 18/35, or .5143. However, there is another way to answer this question, without looking at the diagram. Recall from logic and set mathematics (DeMorgan’s Laws) that “doesn’t plunder and doesn’t pillage” is the opposite (complement) of “plunders or pillages.” This means that we can also get the answer by applying the complements rule to the answer to the previous question: P(doesn’t plunder and doesn’t pillage) = 1 – P(plunders or pillages) = 1 – .4857 = .5143 Follow-up question
www.math.fsu.edu/~wooland/prob1/prob10.html At the Forest Folks Gathering there are 39 jolly hobbits, 41 grumpy hobbits, 19 jolly leprechauns and 25 grumpy leprechauns. If one person is randomly selected, find the probability that he/she is a leprechaun or grumpy. A. .532 B. .202 C. .669 D. .685 Exercise #3
At the Forest Folks Gathering there are 39 jolly hobbits, 41 grumpy hobbits, 19 jolly leprechauns and 25 grumpy leprechauns. If one person is randomly selected, find the probability that he/she is a leprechaun or grumpy. We should understand that aVenn diagram is not needed this time, because the population has been split into four mutually exclusive subcategories; the data is already organized and useable. The total population is 39 + 41 + 19 + 25 = 124. Among the 124 wee folk, the number who are grumpy, or leprechauns, or both, is 41 + 19 + 25 = 85 So, P(G or L) = 85/124 = .685 We have rounded our answer to the same number of decimal places as the multiple choice listings. The correct choice is D. Solution #3
www.math.fsu.edu/~wooland/prob1/prob3.html The table below summarizes preferences of diners at the Hearty Guys Breakfast. If one of these hearty guys is randomly selected, find the probability that he is a construction worker or prefers pancakes. pancakes waffles French totals toast lumberjack 12 14 20 46 construction worker 9 15 8 32 totals 21 29 28 78 A. 0.53 B. 0.68 C. 0.44 D. 0.56 Exercise #4
If one of these hearty guys is randomly selected, find the probability that he is a construction worker or prefers pancakes. Pa W F totals L 12 14 20 46 C 9 15 8 32 Totals 21 29 28 78 Solution #4 We need to know how many Hearty Guys are in this population, and we need to know how many of them are construction workers, or prefer pancakes, or both.
If one of these hearty guys is randomly selected, find the probability that he is a construction worker or prefers pancakes. Pa W F totals L 12 14 20 46 C 9 15 8 32 totals 21 29 28 78 Solution #4, p. 2 We need to know how many Hearty Guys are in this population, and we need to know how many of them are construction workers, or prefer pancakes, or both. The total in the lower right-hand corners tells us that there are 78 Hearty Guys, so this probability will be something over 78.
If one of these hearty guys is randomly selected, find the probability that he is a construction worker or prefers pancakes. Pa W F totals L12 14 20 46 C 9 15 8 32 totals 21 29 28 78 Solution #4, p. 3 Now we count any subcategory that shows a construction worker, or somebody who prefers pancakes, or both (highlighted in red). 9 + 12 + 15 + 8 = 44who are construction workers or prefer pancakes. So, P(C or Pa) = 44/78 = .56 We have rounded to the same number of decimal places as the multiple choice options. The correct answer is D.
Most of the probability questions from Part 3 Module 4 do not require fancy calculations. You just have to think of probability in its most basic sense (a fraction representing “this out of that”), and understand the presentation of data to find the number that goes in the denominator (the total population) and the number that goes in the numerator (those who satisfy the event that you are asked about). Drawing Venn diagrams may be helpful for some problems. You may have to work with percents. Part 3 Module 4 advice
Refer back to the simple example of rolling one die. Let F be the event that the result is a “2.” We know that P(F) = 1/6, because there are 6 equally likely outcomes, one of which is a “2.” Here is a variation on that theme: Suppose that the die roll has already been performed, and we are told that the result was an even number (event E). Would we still say that the P(F) = 1/6? No. Given that we know that an even number was rolled, then there are only three possible outcomes, not six. {2, 4, 6} Of these three possible outcomes, one of them is a “2” so the probability of having rolled a “2,” given that we rolled an even number, is 1/3. Conditional probability
This is an example of conditional probability. Conditional probability arises when we know something about the outcome of an experiment. We must take into account the effect of the given outcome on the probabilities of other events. In the previous case, we say: P(F, given E) = 1/3 Conditional probability
Conditional probability questions are questions of the form, “What is the probability of this event, given that this other event has occurred?” There are special formulas that can be used to calculate P(A, given B). P(A, given B) = n(A and B)/n(B) P(A, given B) = P(A and B)/P(B) The first of the two formulas is useful when we are presented with data in the form of raw numbers. The second formula is useful when we are presented with data in percent form. Calculating conditional probability
In a box we have a bunch of puppies: 4 brown bulldogs 2 gray bulldogs 5 brown poodles 3 gray poodles If one puppy is selected, what is the probability that the puppy is... 1. ...brown? 2. ...a poodle? 3. ...gray or a bulldog? 4. ...brown and a bulldog? 5. ...a bulldog, given that it is gray? 6. ...brown, given that it is a poodle? Example
In a box we have a bunch of puppies: 4 brown bulldogs 2 gray bulldogs 5 brown poodles 3 gray poodles If one puppy is selected, what is the probability that the puppy is... 1. ...brown? P(brown) = 9/14 because 9 of the 14 puppies are brown 2. ...a poodle? P(poodle) = 8/14 because 8 of the 14 puppies are poodles 3. ...gray or a bulldog? P(gray or bulldog) = 9/14 because 9 of the 14 puppies are gray, or bulldogs, or both 4. ...brown and a bulldog? P(brown and bulldog) = 5/14 because 5 of the 14 puppies are brown bulldogs 5. ...a bulldog, given that it is gray? This means that we know we have selected one of the five gray puppies. Among the five gray puppies, two are bulldogs, so P(bd, given g) = 2/5 [this is n(bd and g)/n(g)] 6. ...brown, given that it is a poodle? This means that we know we have selected one of the eight poodles. Among the eight poodles, five are brown, so P(br, given p) = 5/8 [this is n(br and p)/n(p)] Solutions
www.math.fsu.edu/~wooland/prob1/prob15.html At the Annoying Persons Conference there are 22 charming telemarketers, 30 irritating telemarketers, 16 charming life insurance sellers and 21 irritating life insurance sellers. If one person is randomly selected, find the probability that he/she is a life insurance seller given that he/she is charming. A. .42 B. .18 C. .58 D. 1.38 E. .25 Exercise #5
At the Annoying Persons Conference there are 22 charming telemarketers, 30 irritating telemarketers, 16 charming life insurance sellers and 21 irritating life insurance sellers. If one person is randomly selected, find the probability that he/she is a life insurance seller (L) given that he/she is charming (C). We want to find P(L, given C). This means that we know we have selected somebody who is charming, so the baseline for our probability fraction is not 89. The number of people who are charming is 22 + 16 = 38. That is, n(C) = 38 The among these, the number who are life insurance sellers is 16. That is, n(L and C) = 16. So, P(L, given C) = n(L and C)/n(C) = 16/38 = .42 Solution #5
A survey of Gators indicates that 7% are charming, 4% are modest, and 3% are both charming and modest. Find the probability that a Gator is modest, given that he/she is charming. A. .75 B. .03 C. .43 D. .25 Exercise #6
A survey of Gators indicates that 7% are charming (C ), 4% are modest (M), and 3% are both charming and modest (M and C). Find the probability that a Gator is modest, given that he/she is charming. The data tells us that P(M and C) = .03 and P(C ) = .07, so P(M, given C) = P(M and C)/P(C ) = .03/.07 = .43 Solution #6
A survey of Gators indicates that 7% are charming, 4% are modest, and 3% are both charming and modest. Find the probability that a Gator is charming, given that he/she is not modest. A .0417 B. .9600 C. .0400 D. .0437 Exercise #7
A survey of Gators indicates that 7% are charming, 4% are modest, and 3% are both charming and modest. Find the probability that a Gator is charming, given that he/she is not modest. We want to find P(C, given M’). P(C, given M’) = P(C and M’)/P(M’) The data tells us that 4% are modest. This means that 96% are not modest, so P(M’) = .96 The Venn diagram at right shows that another 4% are charming but not Modest, so P(C and M’) = .04. Thus, P(C, given M’) = P(C and M’)/P(M’) =.04/.96 = .0417 Solution #7
www.math.fsu.edu/~wooland/prob1/prob12.html The table below summarizes preferences of diners at the Hearty Guys Breakfast. (This is the same table that we used in in earlier question.) If one of these hearty guys is randomly selected, find the probability that he prefers waffles, given that he is a lumberjack. Pa W F totals L 12 14 20 46 C 9 15 8 32 totals 21 29 28 78 A. 0.18 B. 0.67 C. 0.30 D. 0.14 Exercise #8
If one of these hearty guys is randomly selected, find the probability that he prefers waffles, given that he is a lumberjack. Pa W F totals L 12 14 20 46 C 9 15 8 32 totals 21 29 28 78 We want to use the numbers in the table to form the probability fraction for P(W, given L). Since we are working with raw data, rather than percent data, we use this version of the conditional probability formula: P(W, given L) = n(W and L)/n(L) The table shows that there are 46 lumberjacks, so n(L) = 46. Of the 46 lumbers, 14 of them also prefer waffles, so n(W and L) = 14 Thus, P(W, given L) = n(W and L)/n(L) = 14/46 = .30 (rounded). Solution #8
www.math.fsu.edu/~wooland/prob1/prob18.html The table below shows the distribution according to annual household income of households in the town of Boonies. income percent $0 - $9,999 4% $10,000 - $19,999 10% $20,000 - $29,999 13% $30,000 - $39,999 24% $40,000 - $49,999 21% $50,000 - $59,999 12% $60,000 or more 16% If one household is randomly selected, what is the probability that it has an income less than $40,000, given that its income is greater than $19,999? A. 0.4896 B. 0.4700 C. 0.3700 D. 0.4302 Exercise #9
If one household is randomly selected, what is the probability that it has an income less than $40,000, given that its income is greater than $19,999? Let E be the event that a household’s income is less than $40,000, and let F be the event that a household’s income is greater than $19,999. We want to use the numbers in the table to form the fraction for P(E, given F). income percent $0 - $9,999 4% $10,000 - $19,999 10% $20,000 - $29,999 13% $30,000 - $39,999 24% $40,000 - $49,999 21% $50,000 - $59,999 12% $60,000 or more 16% P(E, given F) = P(E and F)/P(F). The table shows that 86% of the population have income greater that $19,999, so P(F) = .86 The table shows that 37% of the population have income that is greater that $19,999 and also less than $40,000, so P(E and F) = .37 So, P(E, given F) = P(E and F)/P(F) = .37/.86 = .4306 (rounded) Solution #9
Let E be the event that a household’s income is less than $40,000, and let F be the event that a household’s income is greater than $19,999. We want to use the numbers in the table to form the fraction for P(E, given F). income percent $20,000 - $29,999 13 $30,000 - $39,999 24 $40,000 - $49,999 21 $50,000 - $59,999 12 $60,000 or more 16 N = 86 (not 100) So, the denominator for P(E, given F) will be 86, not 100. Solution #9, p. 2
Let E be the event that a household’s income is less than $40,000, and let F be the event that a household’s income is greater than $9,999. We want to use the numbers in the table to form the fraction for P(E, given F). income percent $20,000 - $29,999 13 $30,000 - $39,999 24 $40,000 - $49,999 21 $50,000 - $59,999 12 $60,000 or more 16 N = 86 (not 100) Among the 86 households with income greater than $19,999, those in the two rows highlighted in red have income less than $40,000. The two numbers sum to 37, so P(E, given F) = 37/96 = .3854 Solution #9, p. 3
www.math.fsu.edu/~wooland/prob1/prob15.html At the Annoying Persons Conference there are 22 charming telemarketers, 30 irritating telemarketers, 16 charming life insurance sellers and 21 irritating life insurance sellers. If one person is randomly selected, find the probability that he/she is a life insurance seller given that he/she is charming. A. .42 B. .18 C. .58 D. 1.38 E. .25 Exercise #10
At the Annoying Persons Conference there are 22 charming telemarketers, 30 irritating telemarketers, 16 charming life insurance sellers and 21 irritating life insurance sellers. If one person is randomly selected, find the probability that he/she is a life insurance seller (L) given that he/she is charming (C). We want to find P(L, given C). This means that we know we have selected somebody who is charming, so the baseline for our probability fraction is not 89. The number of people who are charming is 22 + 16 = 38. The among these, the number who are life insurance sellers is 16. So, P(L, given C) = 16/38 = .42 Solution #10