Download
1 / 1
10 likes | 91 Views
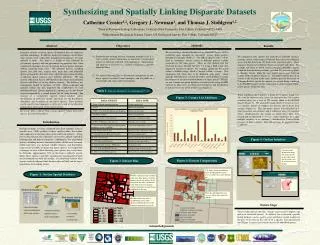
This study involves creating a relational database in Microsoft Access 2000 to consolidate data on non-native species in Colorado obtained from various partners. The database is spatially linked through ArcView 3.2 to analyze species distributions and invasion hotspots. The aim is to make this spatial database accessible online using ArcIMS for users to view distribution maps and predictive models. The project objective is to synthesize multiple datasets on non-native species and disseminate information through an interactive web-based interface. The approach involves hierarchical tables, normalized databases, and multi-scale analyses to create a user-friendly outreach tool for land managers and the public.

E N D
Methods We are creating a relational database using Microsoft Access 2000 to synthesize data obtained on non-native species from partners throughout Colorado (Table 1). The NRCS species codes will be used to standardize species names as different projects include synonyms for the same species. Then, we will spatially link this relational database through ArcView 3.2 using a SQL connection and nested locations of species. For example, a point may be located within a wildlife refuge which is located within a county. This connection will allow data to be displayed with maps. These spatially linked datasets can then be used to create predictive models for hotspots of invasion and distributions of target species. Finally, we aim to make our spatial database available on-line using ArcIMS software to allow users to obtain overall numbers and distributions of non-natives at any given spatial scale (Figure 1). View data and distribution maps for single species or invasion trends for the whole state or a subset of your choice. Figure 2: Dataset Bias Table 1. Data sets obtained (1-6) and promised (7- 14) Figure 5: On-line Interface Figure 1: On-line Spatial Database Figure 4: Dataset Comparisons Figure 3: County List Additions U.S. Forest Service wilderness areas that identified Cirsium arvense where the county list did not. • Objectives • Synthesize pre-existing datasets, including multiple scale (i.e., 1-m2 to entire county) information on non-native vascular plant species in Colorado obtained from individuals, organizations, and agencies at all levels (i.e., federal to local) in a spatially linked database. • Use online GIS technology to disseminate information on non-native species locations to land managers and the public in a user-friendly and easily understood manner. Relational Database Spatial GIS Database Web-based Interface Plots that identified Cirsium arvense where the county list did not. • Hierarchical tables • Normalized database • Multi-scale analyses • Interactive interface • Spatial analyses • Multi-scale graphics • User friendly • Simplistic • Outreach tool Acknowledgements San Luis Valley GIS/GPS Synthesizing and Spatially Linking Disparate Datasets Catherine Crosier1,2, Gregory J. Newman1, and Thomas J. Stohlgren1,2 1Natural Resource Ecology Laboratory, Colorado State University, Fort Collins, Colorado 80523-1499 2Midcontinent Ecological Science Center, US Geological Survey, Fort Collins, Colorado 80525 Abstract Extensive surveys to obtain species distribution data are expensive and time consuming. In addition, many land managers do not know what species occur within their management boundaries, let alone adjacent to them. Yet, there is a wealth of data collected by government agencies and non-government organizations that, when synthesized, maximize the use of existing data on species locations without incurring large costs. We obtained datasets including species lists, plot data, transect data, point data, and individual species polygon data that have been collected using various methods at different spatial scales to meet different objectives. We then created a Microsoft Access 2000 database that relates these different datasets and allows us to use them in concert. The database was subsequently linked to ArcView 3.2 GIS. When combined and spatially linked, the data improved the completeness of each individual dataset. Species reported in a specific area by one dataset were not reported by a second dataset for the same location. The creation of a synthesized, spatially linked database allows development of predictive models and maps for the distribution, abundance, and occurrence of non-native species. These products can be used by land managers at all levels to aid in the detection, management, and control of non-native species. Keywords: Data synthesis, Data synergy, Spatial linking, Non-native species, Ecological Databases Results We compared county species lists from all 63 Colorado counties, manager survey results from 14 National Forest Service wilderness areas, and plot data from 358 multi-scale vegetation plots. These disparate datasets have different biases associated with them. For example, the Biota of North America Program (BONAP) dataset, compiled from herbarium records, recorded 252 non-native plants in Boulder County while the next largest county was Jefferson County with 135 species (Figure 2). This higher number may be an artifact of the location of the state’s herbarium at the University of Colorado Boulder and of the amount of research being conducted in the Boulder County vicinity, rather than an actual hotspot of non-native species within the state. When combining these datasets, a mean of 14 species (range 2 to 46) could be added to each county list from plot data (16 counties contained plots) for a total of 222 records added to the BONAP dataset (Figure 3). We analyzed Canada thistle (Cirsium arvense) as a specific species to compare the datasets and evaluate their synergy (Figure 4). This non-native species was identified in 4 plots (located in two counties) and 8 wilderness areas (12 counties) where, simultaneously, the county in which these plots were located had not identified C. arvense. Some wilderness areas span multiple counties, so we obtained a likelihood for Canada thistle presence in those counties. Thus, datasets may be improved when combined. Introduction Ecological studies are often conducted over short temporal scales in specific areas. With synthesis of these smaller studies, the number and complexity of questions that can be addressed increases. Using pre-existing datasets also capitalizes on resources already expended, reducing time and money constraints. Additionally, lists of probable species, including invasive non-native plants, do not exist for many public land units (e.g. national wildlife refuges), and distribution maps are not available for many non-native species. It is impossible to manage an area without knowing what species may occur there. In Colorado, approximately 50% of the land is publicly owned. Many times, agencies and other organizations managing these lands do not communicate with one another. It is important to know what species occur on adjacent lands because adjacent lands can be source populations for invading species. Boulder county has 252 recorded non-native plant species, but this number may be an artifact of the location of the state’s herbarium at the University of Colorado and the amount of research being conducted in this area. Hinsdale county has only 2 recorded non-native plant species, probably because it has been less intensively surveyed. Future Steps These results indicate that data synergy can be used to improve the quality of individual datasets. In addition, the synthesized, spatially linked database can be used to create predictive spatial models for hotspots of invasion in the state or in a specific land management unit (Figure 5) and to create trend surfaces for individual species.