Download
1 / 36
360 likes | 500 Views
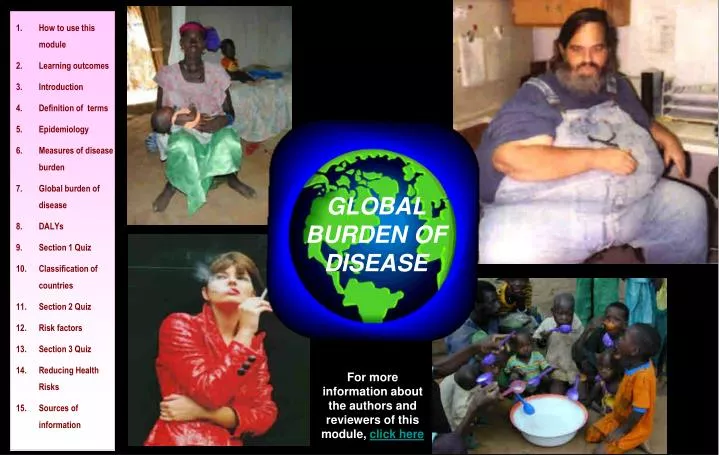
Introduction 1. GLOBAL BURDEN OF DISEASE. For more information about the authors and reviewers of this module, click here. How to use this module. This self-directed learning (SDL) module has been designed for medical and other health care students

E N D
Introduction 1 GLOBAL BURDEN OF DISEASE For more information about the authors and reviewers of this module, click here
How to use this module • This self-directed learning (SDL) module has been designed for medical and other health care students • We suggest that you start with the learning outcomes and try to keep these in mind as you go through the module slide by slide and at your own pace. • Print-out the GBD SDL answer sheet. Write your answers to the questions as best you can before looking at the answers. • Repeat the module until you have achieved a mark of > 19/23 (>80%). • You should research any issues that you are unsure about. Look in your textbooks, access the on-line resources indicated at the end of the module and discuss with your peers and teachers. • Finally, enjoy your learning! We hope that this module will be complement your learning about Global Burden of Disease from other sources.
Learning Outcomes Introduction 1 • By the end of this module, you should be able to : • Describe how disease burden is measured, including: • the definitions of 4 standardised mortality rates and their limitations • how DALYs attempt to capture overall disease burden • Discuss the rationale behind the Global Burden of Disease project • Identify in the different world regions: • the leading diseases • the leading risks to health • Describe the concept of disease transition
Introduction This module is concerned with taking an overview of disease or ill health in the world today. But how can we measure disease at the global level? The obvious and traditional approach is to measure overall mortality in different countries. The next slide shows some of the important, standardised mortality rates that are universally accepted and have specific definitions.
Definitions of standard mortality rates Introduction 1
Click to Reveal Answers What do you think is the current under 5 mortality rate in the following countries (number of deaths <5 years / 1000 live births) ? Britain 6/1,000 China 37/1,000 Nigeria Pakistan 198/1,000 103/1,000 (Source : Unicef State of the World’s Children 2005)
Life expectancy • Life expectancy is another common and useful measure of disease burden • The normal life expectancy is taken as: • 80 years for males • 82 years for females Acknowledgment: http://www.musc.edu/catalyst/archive/1999/co2-11cardiac.htm
Click to Reveal Answers What do you think is the current average life expectancy in these countries? Britain 78 years China 71 years Nigeria Pakistan 51 years 61 years (Source : Unicef State of the World’s Children 2005)
Do we need other estimates of disease burden? • Both mortality rates and life expectancy are useful – but do not tell us anything about disease burden in people living with diseases • This can best be captured by trying to assess quality of life • Another option to express disease burden is in terms of loss of productivity • This is the background to the Global Burden of Disease (GBD) project: attempting to estimate the total burden due to diseases A man with polio begging for money
Introduction 1 What is the GBD (1)? There are some 6 billion people in the world, and hundreds of millions experience disease or injury each year. Taken as a whole, the combined pain, suffering, loss of productivity and unrealised hopes and dreams are our world’s burden of disease ! In other words, the burden of disease is a measurement of the gap between the current health of a population and an ideal scenario where everyone completes their full life expectancy in full health. The Global Burden of Disease project attempts to measure this total disease burden.
What is the GBD (2) ? Introduction 1 • The GBD study is a collaboration between the WHO, the World Bank and the Harvard School of Public Health. • GBD is a measure of the amount of disease, disability, and death in the world today. It is a product of complex and interwoven demographic, economic, social, political, religious and environmental factors. It refers to the collective impact of disease on the world population. • Disease burden can be attributed to either specific diseases (e.g. HIV, TB, obesity, diabetes) and also risks for ill health (unsafe sex, overcrowding, smoking, excess cholesterol). Therefore, the measurement of GBD allows us to address preventable diseases in each region of the world - how much of risks to health could be avoided in future years. • An important development of this project was a single indicator of total disease burden – the DALY.
Disability-Adjusted Life Years (DALYs) Introduction 1 DALY= YLL + YLD Years of Lost Life (due to premature mortality) Years Lost to Disability (due to injury or illness) The DALY is the internationally-accepted measure of death and disability and is increasingly cited as a powerful tool for decision makers in international health. It is the sum of the number of years lost to premature mortality and the number of productive years lost to disability. One DALY is equivalent to one lost year of healthy life. Calculation of DALYs is based on the assumption that everyone in the world has a right to the best life expectancy in the world. The only differences in the rating of a death or disability should be due to age and sex and not to income, culture, location or social class. It’s attractiveness lies in the fact that it combines information about mortality and morbidity in a single number. DALY allows the losses due to disability and the losses due to premature death to be expressed in the same unit. Hence, DALYs facilitate comparisons of different health states or health outcomes.
Sample “DALY” calculations for a disease Introduction 1 Example A: • 100,000 children are stricken for 1 week with a disease with a disability weighting* of 0.3; 2% die at 1 year old. • DALYs = YLL + YLD = (2000 X 80) + (100,000 X 7/365 X 0.3) = 160,000 + 575 = 160,600 Example B: • 100,000 adults are stricken for 2 years with a disease with disability weighting* of 0.6; 20% die at age 80 years. • DALYs = YLL + YLD = (20,000 x 2) + (100,000 x 2 x 0.6) = 40,000 + 120,000 = 160,000 *There are STANDARDISED DISABILITY RATINGS for various conditions e.g deafness= 0.33, Down syndrome=0.5, Diarrhoea=0.12
Why are DALYs important? Introduction 1 DALYs attempt to provide an appropriate, balanced attention to the effects of non-fatal as well as fatal diseases on overall health. In the absence of such assessments, conditions which cause decrements in function but not mortality tend to be neglected. DALYs help to inform debates on priorities for health service delivery, research and planning. For example, DALYs can be used to: • Compare the health of one population with another – and allow decision makers to focus on health systems with the worst performance • Compare the health of the same population at different points in time • Compare the health of subgroups within a population - to identify health inequalities
DALYs attempt to capture the overall disease burden Introduction 1 DALYS *Quality Adjusted Life Years (QALYs) = Number of fully healthy years lost to a particular disease or risk factor
End of Section 1 Well done! You have come to the end of the first section. We suggest that you answer Questions 1 and then 2 to assess your learning so far. Please remember to write your answers on the mark sheet before looking at the correct answers!
Question 1: Mark the following statements as either true or false on your answer sheet. Then click to reveal the answers. Quiz 1 Click for the correct answer • The Infant Mortality Rate (IMR) expresses the number of deaths in the 1st year of life, according to the total number of live and stillbirths • The Perinatal Mortality Rate (PMR) expresses the deaths in infants delivered in the last trimester of pregnancy until the end of the age of 1 month according to the total number of live and stillbirths • In the absence of adverse effects on health, men are expected to live for 80 years • DALYs capture the number of healthy years lost to disability • The calculation of DALYs involves an index of the disability attributed to specific diseases a b c d e
Classification of countries The major diseases that affect people vary markedly in different world regions. Three major groupings of countries can be defined by geography, state of economic and demographic development, and mortality patterns. Source: WHO World Health report 2002
Question 2: Where do the major diseases occur in the world today? Introduction 1 Which country group has the greatest burden of the following diseases? Write down your answers on the answer sheet, then review the correct answers on the next slide.
Introduction 1 Answer 2: Where do the major diseases occur in the world today? All of these diseases occur more commonly in developing countries with high mortality!!
What are the major diseases in the world today? Introduction 1 This bar diagram shows the sharp contrast in disease burden as well as the pattern of diseases in the three country groups – with disease burden measured by DALYs. The diagram shows clearly that the greatest burden for nearly all diseases falls upon people living in group 1 countries. DALYs (000 000) Group I Developing countries + high mortality Group II Developing countries + low mortality Group III Developed countries Source: WHO World Health Report 2002
End of Section 2 Well done! You have come to the end of the second section. We suggest that you proceed to answer question 3 to assess your learning further. Do remember to write your answers on the mark sheet before looking at the right answer!
Question 3: The table shows the % total DALYs for the leading 3 diseases for each group of countries. First write down the group corresponding to each row on the answer sheet and then click for correct answer.
Risks rather than specific diseases • An alternative way of looking at ill health is to consider risks for disease rather than diseases themselves • A risk is defined as the probability of an adverse health outcome or a factor that raises this probability • A single risk factor may underlie several diseases; e.g. unsafe sex is a risk for HIV/AIDS, many other sexually transmitted diseases and teenage pregnancy • It is often more useful to direct health interventions against risks rather than specific diseases • DALYs have been assigned to health risks as well as diseases
Relationship between risks to health and disease burden Introduction 1 Factors which threaten health and are widely spread in populations have been identified in different regions of the world. These risks are strongly related to patterns of living and particularly to consumption. The vast majority of threats to health occur more frequently in the poor and in those with little education and lowly occupations. Therefore, the leading risks to health identified in developing countries are also the leading health risks at the global level: • Underweight – the leading risk factor for disease and death in the world today. Particularly affects young children, women during pregnancy and the elderly. • Unsafe sex - the main factor in the spread of HIV/AIDS. > 99% of HIV infections in Africa are attributable to unsafe sex. • Unsafe water. • Poor sanitation and hygiene - about 2 million deaths from childhood infectious diarrhoea still occur every year in the developing countries of the world. • Iron deficiency. • In-door smoke. Half of the world’s population is exposed to in-door pollution, mainly the result of burning solid fuels for cooking and heating. Globally, it is estimated that 36% of all lower respiratory infections and 22% of chronic obstructive pulmonary disease are associated with in-door pollution.
Introduction 1 What are the major risks to health in the developed world? Overweight and obesity are important determinants of health which lead to adverse metabolic changes, including elevated blood pressure, unfavourable cholesterol levels and increased resistance to insulin. They raise the risk of coronary heart disease, stroke, diabetes mellitus and many forms of cancer. According to the WHO World Health Report 2002, obesity on it’s own accounts for about 200,000 deaths in the United States of America and Canada alone, and about 320,000 deaths in the 20 countries of Western Europe. Tobacco and excess alcohol consumption are major risks to health in the developed world. Alcohol was estimated to cause 20-30% of oesophageal cancer, liver disease, epilepsy, motor vehicle accidents, and homicide worldwide. The world is living dangerously, says Dr Gro Brundtland (Former Director General, WHO) either because it has little choice, which is often the case among the poor, or because it is making the wrong choices in terms of it’s consumption and it’s activities.
The concept of epidemiological transition Introduction 1 As life expectancy increases, the major causes of death and disability shift from communicable, maternal and perinatal causes to chronic, non-communicable ones. • In the developing world: • According to the World Health Report 2002, there has been an increase in the consumption of alcohol and tobacco and an adoption of unhealthy lifestyles synonymous with a Western life style. • This has led to an increased incidence of obesity, diabetes mellitus, cardiovascular diseases and conditions linked to them. Meanwhile, the burden of infectious disease remains. • The resultant burden, consequent on the combined impact of communicable and non-communicable diseases, has been described as a “double whammy”.
Health risks in different world regions • The next 3 slides show the disease burden (measured by DALYs) attributable to 10 leading health risks according to country group • Note how single risks underlie several diseases and how these relationships differ in different regions • Note that the total number of DALYs (x axis) is much greater in the developing than the developed worlds
Burden of disease attributable to 10 selected leading risk factors, by level of development Introduction 1 Burden of disease attributable to 10 selected leading risk factors, by level of development Source of data: WHO World Health report 2002
Burden of disease attributable to 10 selected leading risk factors, by level of development Introduction 1 Source of data: WHO World Health report 2002
End of Section 3 You have come a long way! This is the last of the sections. For the section just ended, answer Questions 4 - 6 to assess what you have learnt. It is still required that you put down your answers on the mark sheet before looking at the right answer!
Introduction 1 Question 4: This picture shows a traditional “three-stone” kitchen in rural West Africa. Write down: a) 3 risks to health b) 4 diseases that can result from these risks Introduction 1 Click to reveal answers
Introduction 1 Introduction 1 Introduction 1 Question 5: Write down 3 risks to health that are associated with regular consumption of the meal shown. Click to Reveal Answers
Introduction 1 Introduction 1 Question 6: List 3 diseases that are associated with the health risk shown in this photograph. Click to Reveal Answers
What strategies can reduce risks to health? Introduction 1 INTERVENTIONS “Any health action - promotive, preventive, curative, or rehabilitative activity, where the primary intent is to improve health.” Most risk- reducing strategies involve a component of behaviour change. The population Reduce risks in the population as a whole The individual Target individuals within a particular population • Legislation, tax, financial • incentives by government • Health promotion campaigns • Engineering solutions; e.g. safety • belts in vehicles, provision of piped • water • Change health behaviours • of individuals through • personal interaction with a • health provider
Sources of information Copy and paste these links into your browser to access these information resources: • The World Health report 2002 – Reducing Risks, Promoting Healthy Life; http://www.who.int/whr/2002/en/ • Unicef State of the World’s Children 2005; http://www.unicef.org/sowc05/english/ Other resources: • Selected major risk factors and global and regional burden of diseaseEzzati M, Lopez AD, Rodgers A, Vander Hoorn S, Murray CJ. The Lancet 2002; 360:1347-1360 • Regional patterns of disability-free life expectancy and disability-adjusted life expectancy: Global Burden of Disease Study; Murray CJ, Lopez AD. The Lancet 1997; 349:1347-1352