Download

1 / 15
150 likes | 181 Views
Explore how incorporating sector realized volatility impacts equity return predictions using the HAR-RV model in consumer goods sector with Proctor & Gamble Co., Avon Products, Inc., and Colgate-Palmolive Co. as examples. Gain insights on regression analysis, significance tests, R-squared values, and potential enhancements.

E N D
HAR-RV with Sector Variance Sharon Lee February 18, 2009
Starting Point • Intuitively, the returns of an individual equity should be correlated with returns from its sector • Using the predictive model HAR-RV, how does incorporating sector realized volatility affect the predicted values for an equity?
Consumer Goods Sector • Proctor & Gamble Co. (PG) • Avon Products, Inc. (AVP) • Colgate-Palmolive Co. (CL)
Background Mathematics Realized Variance, where rt,j is the log-return Sector Realized Variance: Average of same sector stocks in S&P100
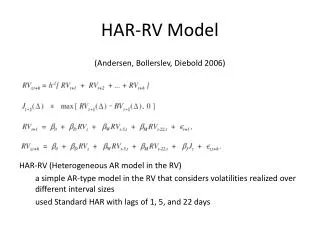
HAR-RV Model • HAR-RV makes use of average realized variance over daily, weekly, and monthly periods. • h=1 corresponds to daily periods, h=5 corresponds to weekly periods, h=22 corresponds to monthly periods • These time horizons correspond to day-ahead, 5-day ahead, and month-ahead predictions of average realized variance.
Linear regression: First Pass • Regressing one-day and five-day PG lag terms on PG return: • Coefficients: • (Intercept) lag1 lag5 • 2.1459 0.4549 0.3180 • Regressing one-day and five-day PG lag terms and one-day and five-day sector lag terms on PG return: • Coefficients: • (Intercept) lag1 lag5 sector1 sector5 • 0.89684 0.08773 0.11054 0.49368 0.13244
What’s Next • Figure out how to run regressions with t-tests for significance • Investigate R-squared values • Incorporate more stocks and sectors • Consider additional regressors