Download
1 / 27
270 likes | 350 Views
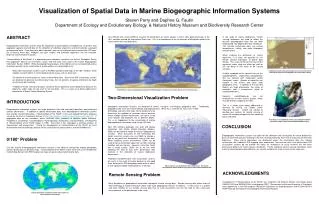
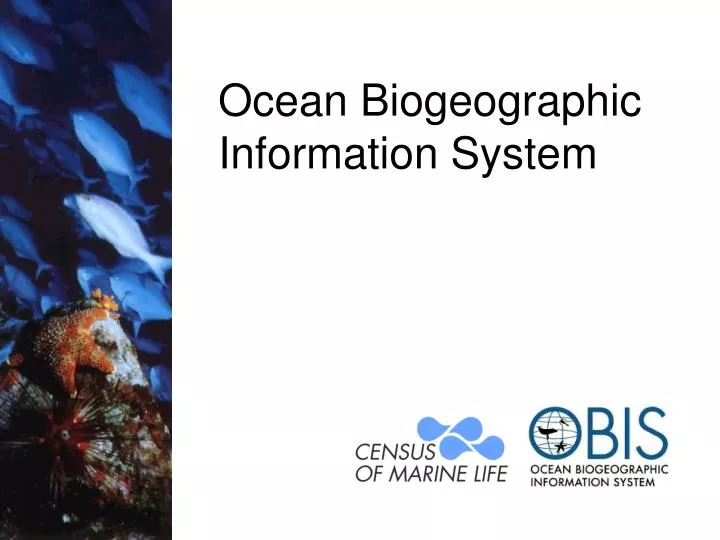
Ocean Biogeographic Information System. ‘Mission’. OBIS publishes primary data on marine species locations online through www.iobis.org It facilitates data discovery and exploration by Searching by species, higher taxa, time, location… Mapping observed occurrences

E N D
‘Mission’ • OBIS publishes primary data on marine species locations online through www.iobis.org • It facilitates data discovery and exploration by • Searching by species, higher taxa, time, location… • Mapping observed occurrences • Modelling of potential environmental range • Integrates data over marine themes • Microbes to whales • Genetics and morphology • Poles to equator… • Enables data capture for re-use • Data archaeology; discovery metadata • Provides the biogeographic context for oceanic biological research
OBIS in context • IT component of CoML • Capturing and integrating data • Support the 2010 synthesis • Marine component of GBIF • Fully inter-operable with GBIF standards • Extending with marine-specific elements • Begin/end point of tracks (trawl) • Marine component of Species 2000 • World register of Marine Species (WoRMS) • http://marinespecies.org • Partner with IOC, FAO, IUCN, UNEP (WCMC) • Hosted by Rutgers University IMCS, funded by Sloan Foundation
Governance • Federation of organisations • Which share a vision: free and open access to biodiversity information • Not a single project, with a single source of funding • Committees • Governing Board • Managers Committee • Managers of Regional OBIS Nodes • Science Board • Working groups
Funding • RONs are self-supporting • Except for yearly meeting • Except for Sloan Grant to set up shop for most • Secretariat • Fully funded by Sloan till 2008 • 2/3 by Sloan from 2008-2010 • After 2010?
Funding sources • Project funding • Proposals submitted to NSF and NOAA • Discussions with Fondation Total • ‘Help from our friends’ • Rutgers University in kind • Core business should not be critically dependent on project (=short term) funding: OBIS is long-term infrastructure
Quality assurance • Serve data from authoritative sources • Cross-check data statistics and map • User feedback buttons for each result • Usage is part of quality control process • Editorial Board • Web statistics – monitor usage (citation system) • Develop peer-review system
OBIS number of records • 519 datasets • 17 million distribution records • 147,000 names, 104,000 taxa • Among the largest provider to the Global Biodiversity Information Facility • Who’s providing data? • Regional OBIS Nodes • Census of Marine Life
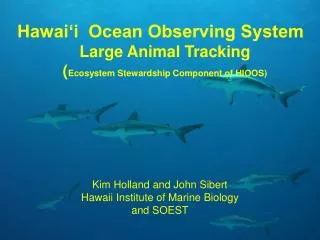
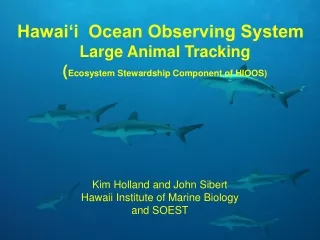
CoML & Ocean Observing An example of how CoML technologies can be implemented in earth and ocean observing systems Some animals dive 1000m 7 seals tracked during 2-3 month summer feeding migrations
Some CoML Discoveries Ceratoserolis – an isopod from the Weddell Sea Athorybia rosacea – a siphonophore from the Sargasso Sea Promachoteuthis sloani – a squid from the mid-Atlantic Ridge Kiwa hirsuta – a crab from around Easter Island (nicknamed the Yeti crab) Palinurus barbarae – a lobster from around Madagascar
Still a lot of work… • We don’t know the total biodiversity • New species are discovered • Selective sampling in geography • Mostly in surface waters • Temperate zones • Selective sampling in taxonomy • Mostly big things, vertebrates
New species are discovered Data from http://marinespecies.org
Analysis of OBIS data • First attempts at diversity pattern on a global scale, with a large number of taxa • Previously either local or on one taxon (e.g. commercial large fish like tuna, forams…) • ‘Safety in numbers’ • Results not affected by idiosyncrasies of single taxon or study • Results very preliminary, and need data cleaning and further checking • E.g. by artificially removing datasets from analysis
Marine fish to be discovered Mora et al (2007). The completeness of taxonomic inventories for describing the global diversity and distribution of marine fishes. Proc. R. Soc. B, published on line Percentage completeness 1 100
Predicting distribution of invasive species, Pterois volitans