Download
1 / 19
190 likes | 224 Views
Explore the causes and impacts of arsenic contamination in Vietnam's Red River Delta, integrating satellite data for advanced modeling. Investigate natural and anthropogenic sources, hydrogeological hypotheses, and applying the Weights of Evidence method.

E N D
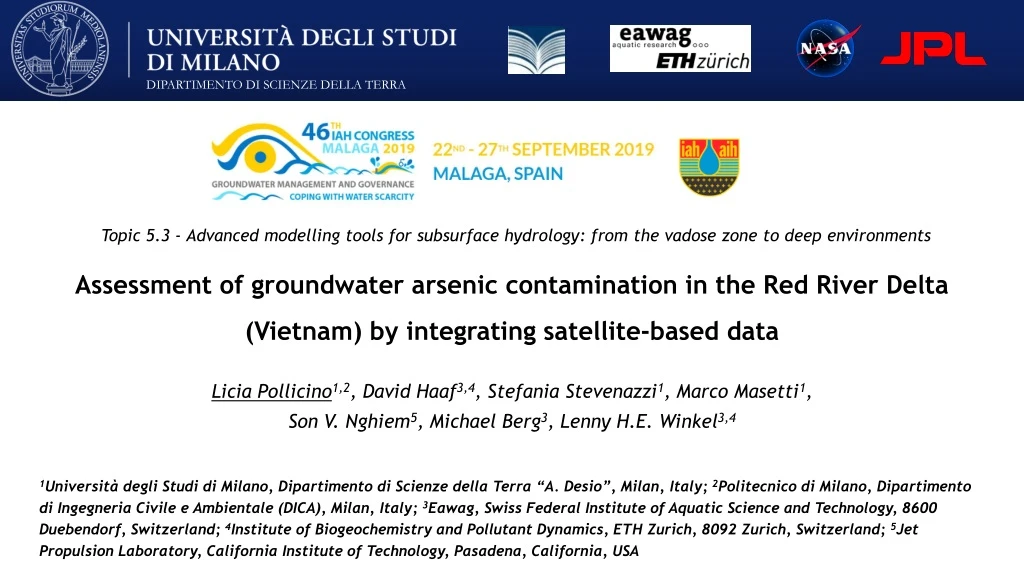
DIPARTIMENTO DI SCIENZE DELLA TERRA Topic 5.3 - Advanced modelling tools for subsurface hydrology: from the vadose zone to deep environments Assessment of groundwater arsenic contamination in the Red River Delta (Vietnam) by integrating satellite-based data Licia Pollicino1,2, David Haaf3,4, Stefania Stevenazzi1, Marco Masetti1, Son V. Nghiem5, Michael Berg3, Lenny H.E. Winkel3,4 1Università degli Studi di Milano, Dipartimento di Scienze della Terra “A. Desio”, Milan, Italy; 2Politecnico di Milano, Dipartimento di Ingegneria Civile e Ambientale (DICA), Milan, Italy; 3Eawag, Swiss Federal Institute of Aquatic Science and Technology, 8600 Duebendorf, Switzerland; 4Institute of Biogeochemistry and Pollutant Dynamics, ETH Zurich, 8092 Zurich, Switzerland; 5Jet Propulsion Laboratory, California Institute of Technology, Pasadena, California, USA
As contamination of groundwater • Natural As contamination of groundwater has become a crucial water quality problem in many regions of the world. • As has beenunequivocally demonstrated to be both toxic and carcinogenic to humans. • Long-term exposure to As from drinking-water can cause cancer, skin lesions, cardiovascular disease and diabetes. • The World Health Organization (WHO) guideline for As in drinking-water is set at 10 µg/L. Source: British Geological Survey (BGS) DIPARTIMENTO DI SCIENZE DELLA TERRA
Sources of As contamination NATURAL SOURCES • Geothermal and volcanic activities • Weathering of As-bearing rocks and minerals ANTHROPOGENIC SOURCES • Pesticides • Herbicides • Fertilizers • Landfill leakage • Mining and metallurgical processes • Sewage • Chemical industries Modified from Fishbein et al. (1981) DIPARTIMENTO DI SCIENZE DELLA TERRA
As contamination in the Red River Delta of Vietnam • The Red River Delta is one of the most densely populated regions in the world, with a population density of about 1,160 people/km2 and an area of 14,000 km2. D’ Red River D • The aquifers exploited are of both Holocene and Pleistocene age. Holocene sediments are separated from the underlying Pleistocene sediments by a clay layer several meters thick. In some locations the aquifers are connected by sand lenses. Vietnam • In this region, the groundwaters are strongly reducing with high concentrations of Fe, Mn and NH4+. from Winkel et al. (2011) DIPARTIMENTO DI SCIENZE DELLA TERRA
Conceptual hydrogeological model Hypotheses to test: The link between As contamination in the deep aquifer and highly urbanised areas (i.e., areas with intensive groundwater pumping). The relationship between As contamination in the Pleistocene aquifer and the vertical transport of As-enriched waters from the Holocene aquifer to the underlying aquifer. The compaction of interbedded clays as potential mechanism responsible for As expulsion and mobilisation into the deep aquifer. Modified from Erban et al. (2013) DIPARTIMENTO DI SCIENZE DELLA TERRA
The Weights of Evidence (WofE) method • The WofE is a cell-based modelling technique that can be used to generate predictive probability models by quantitatively evaluating the degree of spatial association between high concentrations of a pollutant (Training Points, TPs) and factors potentially controlling the distribution of the contamination (predictor factors). Input Output A) Dependent variable (pollutant concentration) B) Predictor factors influencing the contamination Posterior Probability map Susceptibility map Groundwater velocity Threshold value Groundwater depth Urban extent Control Points Training Points Thickness of the aquitard Susceptibility classes High probability Low probability Calculation of specific statistical parameters including: reclassification • Weights • Contrast • Confidence level Contaminant concentration (µg/L) Bonham-Carter (1994) DIPARTIMENTO DI SCIENZE DELLA TERRA
Dependent variable: As concentration in the Pleistocene aquifer • The dependent variable is expressed in a binary form • As concentration data collected in the Pleistocene aquifer in the period from 2005 to 2007 Statistics Frequency As concentration (ppb) Training Points – TPs (wells ≥10 μg/L) Threshold value = 10 μg/L (WHO guideline value) Control Points – CPs (wells <10 μg/L) DIPARTIMENTO DI SCIENZE DELLA TERRA
Independent variables: Factors influencing As pollution in the Pleistocene aquifer Factors causing reducing conditions in the Pleistocene aquifer: Factors controlling As mobilisation mechanism in the Pleistocene aquifer: NW Groundwater flow direction at the regional scale SE Factors considered as potential sources responsible for As contamination in the Pleistocene aquifer: Urban pattern as a proxy for intensive groundwater abstraction, measured using the satellite QuickSCAT data processed with the Dense Sampling Method, DSM (Nghiem et al., 2009) and the Focal Method (ArcGIS). As concentration close to the aquitard (ppb) DIPARTIMENTO DI SCIENZE DELLA TERRA
Analysis of influencing factors Each factor is generalised into classes; For each class weights, contrast and confidence values are calculated; Each factor is reclassified to obtain the maximum number of statistically significant classes. • A positive contrast defines a DIRECTcorrelation with the contamination. • A negative contrast indicates an INVERSE correlation with the contamination. Classes DIRECTLY correlated with As concentrations above 10 µg/L DIPARTIMENTO DI SCIENZE DELLA TERRA
Posterior Probability Maps • DOC • NH4 • Urban pattern • As concentration in the Holocene aquifer • As concentration close to the aquitard • DOC • NH4 • Urban pattern • As concentration in the Holocene aquifer • DOC • NH4 • Urban pattern • As concentration close to the aquitard DIPARTIMENTO DI SCIENZE DELLA TERRA
Reliability of the Posterior Probability Maps AUC = 75.2% AUC = 75.0% AUC = 72.5% • DOC • NH4 • Urban pattern • As concentration in the Holocene aquifer • As concentration close to the aquitard • DOC • NH4 • Urban pattern • As concentration in the Holocene aquifer • DOC • NH4 • Urban pattern • As concentration close to the aquitard DIPARTIMENTO DI SCIENZE DELLA TERRA
Reclassified Susceptibility Maps • DOC • NH4 • Urban pattern • As concentration in the Holocene aquifer • As concentration close to the aquitard • DOC • NH4 • Urban pattern • As concentration in the Holocene aquifer • DOC • NH4 • Urban pattern • As concentration close to the aquitard DIPARTIMENTO DI SCIENZE DELLA TERRA
Uncertainty of the Posterior Probability Maps Areas with a high degree of uncertainty <1.282 (Test Value) The whole area is characterised by > 1.282 Bonham-Carter et al. (1989) DIPARTIMENTO DI SCIENZE DELLA TERRA
Validation of the reclassified Susceptibility Maps: Frequency of TPs • DOC • NH4 • Urban pattern • As concentration in the Holocene aquifer • As concentration close to the aquitard • DOC • NH4 • Urban pattern • As concentration in the Holocene aquifer • DOC • NH4 • Urban pattern • As concentration close to the aquitard DIPARTIMENTO DI SCIENZE DELLA TERRA
Validation of the reclassified Susceptibility Maps: Mean As concentration • DOC • NH4 • Urban pattern • As concentration in the Holocene aquifer • As concentration close to the aquitard not representative because based on two data • DOC • NH4 • Urban pattern • As concentration in the Holocene aquifer • DOC • NH4 • Urban pattern • As concentration close to the aquitard DIPARTIMENTO DI SCIENZE DELLA TERRA
Conclusions The preliminary results derived from the WofE analysis highlighted: The significant influence that reducing environments have on the occurrence of elevated As levels in groundwater; The existence of a relationship between densely urbanised areas and high As concentrations in the Pleistocene aquifer; The potential sources of As mobilisation in the Pleistocene aquifer including: • As-enriched waters contained in the upper aquifer and transported to the underlying aquifer • high-As waters expelled from the compaction of interbedded clays into the deep aquifer The difficulty in precisely identifying, among the two potential sources, the one responsible for As release in the deep aquifer; The importance of recognising deep aquifer as not a safe long-term water source of drinking water. DIPARTIMENTO DI SCIENZE DELLA TERRA
Acknowledgments: The research at the Jet Propulsion Laboratory, California Institute of Technology, was supported by the NASA Land Cover/Land Use Change Program and in part by the NASA Earth Science R&A Program. Thanks for your attention!
Building of predictor factors • Maps representing DOC and NH4+ pattern in the Pleistocene aquifer and As concentrations in the Holocene aquifer and close to the aquitard were generated by using the Ordinary Kriging interpolation method. CV: Residual CV: Residual Median = -0.3 Mean = -0.01 Median = -0.3 Mean = -0.01 As concentration close to the aquitard (ppb) • Maps representing DOC and NH4+ pattern in the Pleistocene aquifer show a preferential direction corresponding to the groundwater flow direction at the regional scale. CV: Residual CV: Residual Median = -0.3 Mean = 0.02 Median = -0.3 Mean = 0.1 DIPARTIMENTO DI SCIENZE DELLA TERRA
Building of predictor factors Urban pattern as a proxy for intensive groundwater abstraction, measured using the satellite QuickSCAT data processed with the Dense Sampling Method, DSM (Nghiem et al., 2009) and the Focal Method (ArcGIS). NW Before FM Groundwater flow direction at the regional scale After FM -8 -6 -7 -9 -6 -8 -8 -7 -9 -7 -7 -8 -9 -8 -8 -8 -6 -8 -8 -7 The focal method (FM) allows taking into account the groundwater flow direction and, thus, the influence of groundwater flow on the dispersion of contaminants caused by the presence and the activities in urban areas (i.e., groundwater abstraction). SE -6 -7 -9 -7 -7 -7 -7 -8 -7 -7 -6 -7 -6 -6 -6 -7 -7 -8 -6 -7 -6 -7 -7 -6 -6 -6 -6 -7 -8 -7 DIPARTIMENTO DI SCIENZE DELLA TERRA