Download
1 / 9
90 likes | 288 Views
INFONET Seminar Application Group 2013/08/13 Compressed sensing in photoacoustic tomography Lihong V. Wang. Journal of Biomedical Optics 2010 Presenter Pavel Ni. Contents. Introduction Compressive sensing Results Conclusion. Introduction. Photoacoustic formation sound waves,

E N D
INFONET Seminar Application Group 2013/08/13 Compressed sensing in photoacoustic tomography Lihong V. Wang. Journal of Biomedical Optics 2010 Presenter Pavel Ni
Contents • Introduction • Compressive sensing • Results • Conclusion
Introduction • Photoacoustic formation sound waves, • following light absorption in a material sample. • For Photoacoustic effect the light intensity • must vary periodically or as a single flash. • The Photoacoustic effect is quantified • by measuring the formed sound. • By processing acquired signal map • of absorbed light can be reconstructed. Pic. 1. Optical modalities compared to photoacoustic • Tissues are irradiated by a pulsed laser • Absorbed energy converted into heat • Which further converted to thermoelastic expansion • Initial pressure raise then propagates as ultrasonic waves • Laser could be replaced by microwave or RF sources
Introduction Pic. 3. a) Noninvasive PAT image of the superficial layer of a rat brain acquired with the skin and skull intact b) Open-skull photograph of the rat brain surface after PAT Pic. 2. Photoacoustic setup • Unfocused ultrasonic transducer with 512 elements is placed • outside of object • 64-channel data acquisition module (DAQ) is used
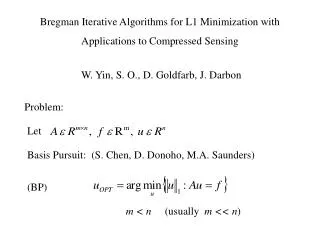
Compressive sensing Pressure measurement at detecting aperture Initial pressure raises distribution (1) Forward problem which predicts by Where c-is a speed of sound, is a position of ultrasonic sensor Velocity potential (2) Inverse problem which reconstruct with Where , S0is the detecting aperture, solid-angle weighting factor
Compressive sensing x to represent where each element of x is the average value of initial pressure per unit volume Size of x depends on the field of view (Nx*Ny*Nz) Vector y is velocity potential measured by all sensors as a function of time Size of y is the number of detecting positions (L) times the number of temporal position (M) Forward problem can be described as Where is projection matrix Inverse problem can be written as Where is reconstructed image containing Nx*Ny*Nz*L*M Even for 256x256 image with measurement fro 512 positions, each position has 1024 time points contain 3.4x10¹⁰ points (~256 GB)
Results Pic. 4. (a) to (d) Images reconstructed using the BP method with 240, 120, 80, and 60 tomographic angles. (e) to (h) Images reconstructed using the CS method with 240, 120, 80, and 60 tomographic angles. (i) to (l) Images reconstructed using the traditional iterative reconstruction method with 240, 120, 80, and 60 tomographic angles. (m) Lines extracted from (a), (d), (h), and (l). (n) Comparison of the mean square errors of the three reconstruction methods.
Conclusion They demonstrated the CS method using tissue-mimicking phantom with 3 human hair crosses with interval 10 mm. Laser pulses 10 Hz. 20 measurements at 240 different angles. Acquisition time was 8 min. Experiment shows that CS method can efficiently reduce the undersampling artifacts. Pic. 5. used PA setup