Download
1 / 12
120 likes | 136 Views
0.0 0.5 1.0. Probability. GIS application of distributed modeling for predicting potential non-point sources of water pollution for watershed management. Pece V. Gorsevski, Paul Gessler, and Jan Boll University of Idaho. Definition of NPS.

E N D
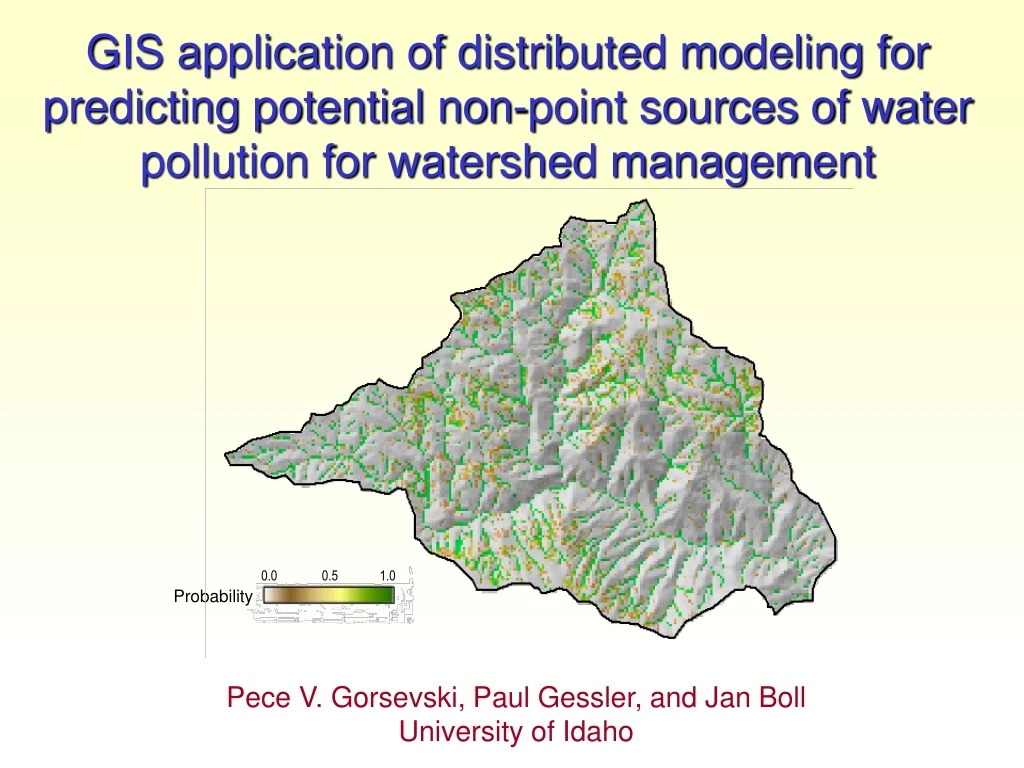
0.0 0.5 1.0 Probability GIS application of distributed modeling for predicting potential non-point sources of water pollution for watershed management Pece V. Gorsevski, Paul Gessler, and Jan Boll University of Idaho
Definition of NPS • Variable Source Areas (VSA) are saturated areas that are initiated primarily from runoff, while falling rain on these areas becomes overland flow. • In each watershed, regions exist that are more susceptible to producing runoff than others, often considered as Hydrologically Active Areas (HAA). • When a pollutant is present in these HAA, the area is considered a Hydrologically Sensitive Area (HSA). Introduction
Evapotranspiration Lateral Flow In Precipitation Surface Runoff Soil Layers Lateral Flow Out Percolation Soil Moisture Routing (SMR) Model (Frankenberger et al., 1998; Boll et al., 1998) Overview of the GIS-Based Integrated Approach
(Speight, 1974; Bevan & Kirkby, 1979; Moore et al. 1991; 1993) CTI = ln(As / tan β) where: Asis the specific catchment area (contributing area (m2) per unit width of contour orthogonal to the flow direction) βis the slope angle in degrees “a quantification of catenary landscape position” Compound Topographic Index (Wetness Index) Overview of the GIS-Based Integrated Approach
7.18 By Quartile 8.64 9.17 9.98 C~U(a,b) Range P 23.35 a b Estimated - Soil Depth Data (Soil Survey Geographic Database (SSURGO) (USDA-NRCS, 2001) and the approach of Flanagan and Livingston (1995) and Saxton et al. (1986)) Monte Carlo Overview of the GIS-Based Integrated Approach
Land Use Data 44 % 28 % 28 % CC R F Study Area Application of the Modeling Approach
Temperature (C) -20 0 10 20 30 40 Hyetographstorm events 1995-96 Rainfall (cm/day) 0 1 2 3 4 5 6 MaximumMinimum Observed Temperature (adjusted for elevation by a lapse rate of 0.64 °C per 100 meters) 09/01/95 09/01/95 09/01/95 11/13/95 11/13/95 11/13/95 01/25/96 01/25/96 01/25/96 04/07/96 04/07/96 04/07/96 06/19/96 06/19/96 06/19/96 08/31/96 08/31/96 08/31/96 Estimated PET (Hargreaves, 1995 ) PET (cm/day) 0 0.2 0.4 0.6 0.8 Time in days Climatic Data Application of the Modeling Approach
PredictedObserved Discharge (cms) Time in days Model Calibration Predicted versus observed stream flow for the Pete King watershed Application of the Modeling Approach
Analysis of Temporal Prediction Results
0.0 0.5 1.0 Probability 0 1 2 4 Kilometers Analysis of Spatial Prediction Results
Analysis of Spatial Prediction Monthly percent of HSAs and runoff originating from these areas. Monthly percent of HSAs organized by vegetation classes. Results
Conclusion • Results showed that due to seasonal variability of saturated areas the HSA also vary spatially andtemporally. • Mapping the extent of specific locations that are potential NPS areas of water pollution at one time of the year but which are insensitive at another may help decision-makers to select the best combination of BMPs through optimization techniques (i.e., linear, goal, or integer programming) while meeting TMDL requirements. • The example application demonstrated the potential of this approach in yielding valuable site-specific information especially in areas where distributed parameters are infrequent. Conclusion