Download
1 / 19
190 likes | 206 Views
Understand the scoring procedures at Riverwood Middle School and interpret your PSAT/NMSQT predicted score ranges in Reading, Math, and Writing. Learn about critical success factors for college readiness and access detailed results reports to improve your academic skills. Visit readistep.collegeboard.org/student for more information.

E N D
Interpreting Scores • Score Range is from 2.0 – 8.0 • The total raw score for each test is calculated by a “rights-only” scoring procedure • They are adjusted for differences in difficulty between various forms, or editions, of the test
According to the College Board, students are college ready when they have the knowledge, skills and behaviors to complete a college-level course of study successfully, without remediation. Four critical success factors characterize college ready students: • Achievement of academic content knowledge, evidenced by completion of a rigorous high school core curriculum aligned to college readiness standards • Attainment of advanced academic skills, developed through an instructional focus on critical thinking, reasoning, problem solving, writing, and strong study skills • Successful completion of college-level and other advanced courses taken in high school • Acquisition of college planning skills, demonstrated by an understanding of college and career options and the college admission and financing process
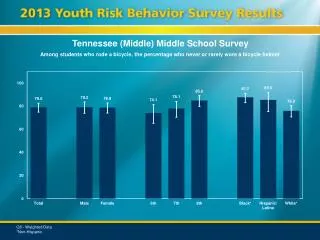
Predicted PSAT/NMSQT Score Ranges Predicted score ranges below show how an eighth grade ReadiStep test-taker would be expected to perform on the PSAT/NMSQT in 10th grade, given a normal level of academic growth.
Reading • Mean Score = 5.6 • National Percentile = 69 • Local Percentile = 82 • Math • Mean Score = 5.8 • National Percentile = 76 • Local Percentile = 82 Riverwood's • Writing • Mean Score = 6.0 • National Percentile = 83 • Local Percentile = 84 Results
The website at the bottom of the student result page will give further explanation of your results and ways you can improve your skills. readistep.collegeboard.org/student