Download
1 / 63
630 likes | 634 Views
Primary Cause of Kidney Failure in new ESRD patients at initiation, by ethnicity figure 2.1, 1997-2000 combined. Percent of new patients with diabetes as the primary cause of renal failure figure 2.2, 1999-2000 combined, by HSA, unadjusted. Percent of patients 47.8+ (52.0) 45.5 to <47.8

E N D
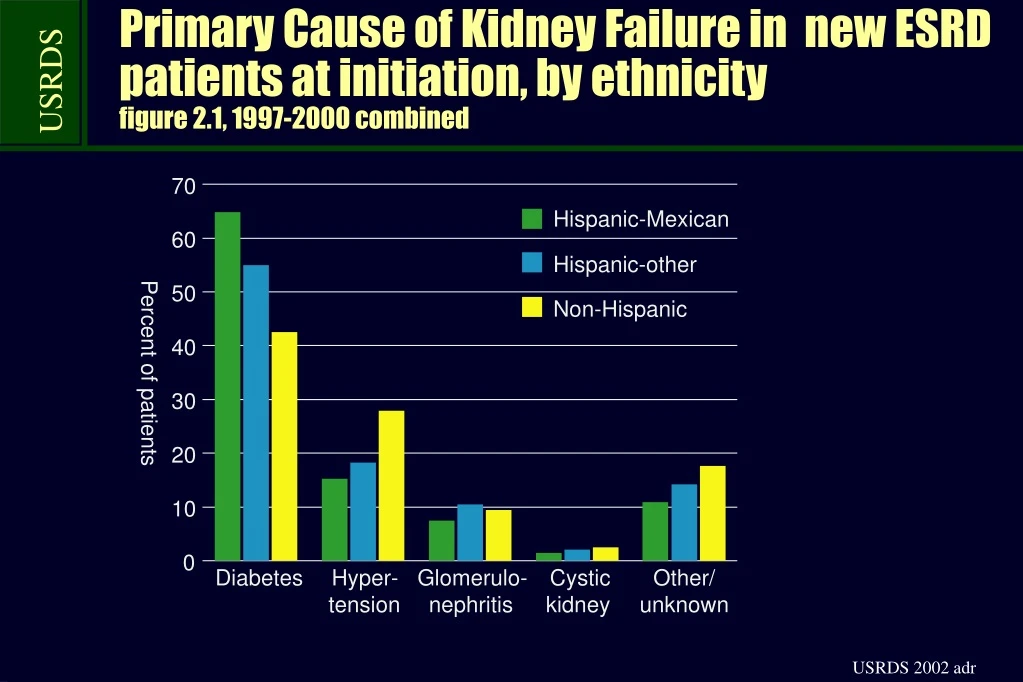
Primary Cause of Kidney Failure in new ESRD patients at initiation, by ethnicityfigure 2.1, 1997-2000 combined
Percent of new patients with diabetes as the primary cause of renal failurefigure 2.2, 1999-2000 combined, by HSA, unadjusted Percent of patients 47.8+ (52.0) 45.5 to <47.8 43.9 to <45.5 42.2 to <43.9 below 42.2 (40.5)
Cardiovascular comorbidity at initiation:diabeticsfigure 2.3, 2000, by HSA, unadjusted Percent of patients 43.8+ (48.7) 39.7 to <43.8 36.8 to <39.7 33.5 to <36.8 below 33.5 (29.8)
Cardiovascular comorbidity at initiation:non-diabeticsfigure 2.3, 2000, by HSA, unadjusted Percent of patients 34.0+ (37.2) 30.1 to <34.0 26.2 to <30.1 24.0 to <26.2 below 24.0 (21.8)
Trends in cardiovascular comorb. from inpatient hospitalization diagnosis codes, in patients surviving one-year after ESRD figure 2.4, incident ESRD patients
Trends in cardiovascular comorb. developed in the two years prior to dialysis, patients 67 years & olderfigure 2.5, incident ESRD patients
Trends in the number of comorbid conditions at initiationfigure 2.6, incident ESRD patients
Trends in the occurrence of diabetes as a primary or secondary complication, by race/ethnicity figure 2.7, incident ESRD patients All White Black Percent of patients
Trends in the occurrence of diabetes as a primary or secondary complication, by race/ethnicity figure 2.7, incident ESRD patients Native American Asian Hispanic Percent of patients
% of pts at initiation with serum albumin < test’s lower limit, by age& genderfigure 2.8, incident ESRD patients Age Gender
% of pts at initiation with serum albumin < test’s lower limit, by race, & primary diagnosisfigure 2.8, incident ESRD patients (cont.) Race Primary diagnosis Percent of patients
Geographic variations in the % of patients at initiation with albumin levels below the test’s lower limit: 1995figure 2.9, incident ESRD patients, by HSA, unadjusted Percent of patients 64.3+ (66.1) 62.9 to <64.3 58.5 to 62.9 56.8 to <58.5 below 56.8 (55.7)
Geographic variations in the % of patients at initiation with albumin levels below the test’s lower limit: 2000figure 2.9, incident ESRD patients, by HSA, unadjusted Percent of patients 64.3+ (65.2) 62.9 to <64.3 58.5 to <62.9 56.8 to <58.5 below 56.8 (NA)
Geographic variations in the % of pts at initiation with allbumin levels < the test’s lower limit: % change 1995-2000figure 2.9, incident ESRD patients, by HSA, unadjusted Percent change 14.2+ (16.2) 11.9 to <14.2 10.2 to 11.9 9.0 to <10.2 below 9.0 (7.8)
Trends in EPO use prior to initiation, by age & genderfigure 2.10, incident ESRD patients
Trends in EPO use prior to initiation, by race/ethnicity & genderfigure 2.11, incident ESRD patients
Trends in mean hemoglobin at initiation, by EPO treatmentfigure 2.12, incident ESRD patients
Geographic variations in the percent of patients receiving EPO prior to initiation, by race: allfigure 2.13, 1999-2000 combined, incident ESRD patients, by HSA, unadjusted Percent of patients 34.7+ (41.8) 28.8 to <34.7 24.2 to <28.8 19.6 to <24.2 below 19.6 (16.4)
Geographic variations in the percent of patients receiving EPO prior to initiation, by race: whitefigure 2.13, 1999-2000 combined, incident ESRD patients, by HSA, unadjusted Percent of patients 34.7+ (41.3) 28.8 to <34.7 24.2 to <28.8 19.6 to <24.2 below 19.6 (17.1)
Geographic variations in the % of pts receiving EPO prior to initiation, by race: non-whitefigure 2.13, 1999-2000 combined, incident ESRD patients, by HSA, unadjusted Percent of patients 34.7+ (41.2) 28.8 to <34.7 24.2 to <28.8 19.6 to <24.2 below 19.6 (16.4)
Trends in hemoglobin level from the Medical Evidence Form 2728 at initiationfigure 2.14, incident ESRD patients
Trends in mean hemoglobin at initiation, by age & genderfigure 2.15, incident ESRD patients
Trends in mean hemoglobin at initiation, by race/ethnicity & genderfigure 2.16, incident ESRD patients
Trends in mean hemoglobin at initiation, by modalityfigure 2.17, incident ESRD patients
Geographic variations in mean hemoglobin at initiation: allfigure 2.18, 1999-2000 combined, incident ESRD patients, by HSA, unadjusted Mean hemoglobin (g/dl) 10.0+ (10.1) 9.8 to <10.0 9.7 to <9.8 9.6 to <9.7 below 9.6 (9.5)
Geographic variations in mean hemoglobin at initiation: whitefigure 2.18, 1999-2000 combined, incident ESRD patients, by HSA, unadjusted Mean hemoglobin (g/dl) 10.0+ (10.2) 9.8 to <10.0 9.7 to <9.8 9.6 to <9.7 below 9.6 (9.4)
Geographic variations in mean hemoglobin at initiation: non-whitefigure 2.18, 1999-2000 combined, incident ESRD patients, by HSA, unadjusted Mean hemoglobin (g/dl) 10.0+ (10.3) 9.8 to <10.0 9.7 to <9.8 9.6 to <9.7 below 9.6 (9.5)
Geographic variations in mean BUN at initiation: 2000figure 2.19, incident ESRD patients, by HSA, unadjusted Mean BUN (mg/dl) 89.1+ (92.0) 87.4 to <89.1 85.9 to <87.4 84.4 to <85.9 below 84.4 (81.5)
Geographic variations in mean BUN at initiation, percent change : 1995-2000figure 2.19, incident ESRD patients, by HSA, unadjusted Percent change -5.3+ (-3.2) -6.5 to <-5.3 -7.9 to <-6.5 -9.7 to <-7.9 below -9.7 (-13.0)
Trends in mean BUN at initiation, by age & race/ethnicityfigure 2.20, incident ESRD patients
Geographic variations in mean serum creatinine at initiationfigure 2.21, incident ESRD patients, by HSA, unadjusted Serum creatinine (mg/dl) 7.59+ (7.94) 7.31 to <7.59 7.00 to <7.31 6.72 to <7.00 below 6.72 (6.49)
Geographic variations in mean serum creatinine at initiation, % change: 1995-2000 figure 2.21, incident ESRD patients, by HSA, unadjusted Percent change -11.3+ (-8.5) -14.3 to <-11.3 -16.7 to <-14.3 -19.5 to <-16.7 below -19.5 (-21.9)
Trends in mean serum creatinine at initiation, by age & race/ethnicityfigure 2.22, incident ESRD patients
Geographic variations in mean eGFR at initiation: 2000figure 2.23, incident ESRD patients, by HSA, unadjusted eGFR (ml/min) 8.91+ (9.25) 8.57 to <8.91 8.38 to <8.57 8.22 to <8.38 below 8.22 (8.03))
Geographic variations in mean eGFR at initiation, % change: 1995-2000figure 2.23, incident ESRD patients, by HSA, unadjusted Percent change 22.8+ (27.4) 20.0 to <22.8 18.0 to <20.0 15.9 to <18.0 below 15.9 (13.5)
Trends in mean eGFR at initiation, by age & race/ethnicityfigure 2.24
Geographic variations in mean BMI at initiation: 2000figure 2.25, incident ESRD patients, by HSA, unadjusted BMI (kg/m2) 27.0+ (27.2) 26.9 to <27.0 26.8 to <26.9 26.7 to <26.8 below 26.7 (26.5)
Geographic variations in mean BMI at initiation, % change: 1995-2000figure 2.25, incident ESRD patients, by HSA, unadjusted Percent change 7.15+ (9.69) 5.73 to <7.15 4.57 to <5.73 3.05 to <4.57 below 3.05 (0.53)
Trends in mean BMI at initiation, by age & race/ethnicityfigure 2.26, incident ESRD patients
BMI distribution in Patients with a history of cardiovascular disease & strokefigure 2.27 by age, race and ethnicity
BMI distribution in Patients with a history of cardiovascular disease & stroke figure 2.28 by age, race and ethnicity
Differences in eGFR at initiation, by age, race/ethnicity, diabetic status, & genderfigure 2.29 Diabetics
Differences in eGFR at initiation, by age, race/ethnicity, diabetic status, & genderfigure 2.29 (con.t) Non-diabetics
Differences in eGFR at initiation, by pre-ESRD hospital days, age, & gender, patients 67 & olderfigure 2.30
Differences in eGFR at initiation, by Charlson score, & age, patients 67 & olderfigure 2.31
Differences in eGFR at initiation, by Charlson score, & gender, patients 67 & olderfigure 2.31 (cont.)
Event curves for first hospitalization in the first year of ESRD, by eGFR at initiationfigure 2.32, incident dialysis patients, 1998-1999 combined
Event curves for survival in the first year of ESRD, by eGFR at initiationfigure 2.33, incident dialysis patients, 1998-1999 combined
Percent survival, by eGFR at initiation & racefigure 2.34, incident dialysis patients, 1998-1999 combined
Percents receiving EPO before initiation, by race/ethnicity & insurance coveragefigure 2.35, incident ESRD patients, 2000 Percent of patients All W B NA A H All W B NA A H All W B NA A H All W B NA A H