Download
1 / 16
160 likes | 345 Views
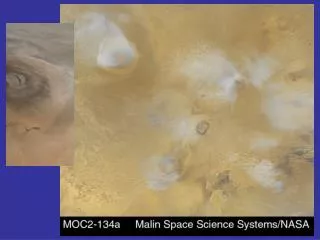
Evolution of primary planetary atmospheres Philip von Paris 1) , John Lee Grenfell 1) , Pascal Hedelt 1) , Heike Rauer 1,2) , Barbara Stracke 1) 1) Institut für Planetenforschung, DLR Berlin 2) Zentrum für Astronomie und Astrophysik, TU Berlin. Characterization of Terrestrial Exoplanets.

E N D
Evolution of primary planetary atmospheres Philip von Paris1), John Lee Grenfell1), Pascal Hedelt1), Heike Rauer1,2), Barbara Stracke1) 1)Institut für Planetenforschung, DLR Berlin 2)Zentrum für Astronomie und Astrophysik, TU Berlin
Characterization of Terrestrial Exoplanets • Satellite missions are on-going or planned to look for small, rocky planets and characterize their atmospheres: CoRoT, Kepler, Darwin/TPF • Spectral signatures might be indicative of a biosphere on a terrestrial planet • Atmospheric modeling helps in mission design and data interpretation • Terrestrial planets are expected to be found at different ages: Models needed to track the atmosphere in the course of planetary evolution CNES ESA
The faint young Sun „paradoxon“ The young Sun was less bright than today. - Surface temperatures below 273 K before 2 Gyr ago if greenhouse effect was at present level (i.e., ΔT ~30 K) But: - Geological hints for liquid water as early as 4 Gyr ago (e.g., Mojzsis et al. 1996, Rosing & Frei 2004) r Dashed line: Gough (1981) Plain line: Caldeira and Kasting (1992)
Proposed solutions to the „paradoxon“ Atmospheric composition changed since the first primitive atmosphere, hence the greenhouse effect was more pronounced. Several greenhouse gases have been proposed:
Problems with the proposed solutions • Ammonia: Rapid photolytic destruction, UV shielding via haze formation in an anoxic atmosphere: model results not clear ( Sagan & Chyba 1997 <-> Pavlov et al. 2001) • Carbon dioxide: Sediment data sets upper limits on partial pressure, much less than needed in model studies (Rye et al. 1995, Hessler et al. 2004) • Methane: Outgassing rates and biogenic production not well determined (Pavlov et al. 2003 <-> Kharecha et al. 2005), dominating photochemical sink not well established • Ethane: Formation of needed hydrocarbon haze dependent on ratio between methane and carbon dioxide
This work: Model description Type: 1D radiative-convective model for temperature and water profiles Based on Kasting (1984,1988), Pavlov et al. (2000) and Segura et al. (2003): Temperature profile: from radiative equilibrium and convective adjustment Water profile: from relative humidity distribution (Manabe & Wetherald 1967)
IR-Fluss stellarer Fluss Klima Chemie Chemisches Reaktions-netzwerk berücksichtigt 55 Spezies, 220 Reaktionen Stratosphäre Strahlungsgleichgewicht, F aus Strahlungstransportgl. Troposphäre trocken- oder feuchtadiabatisches T-Profil biogene-Flüsse Profile chemischer Konzentrationen T, p Profil
This work: Model description New in our model: Adapted IR radiation transfer modeling (MRAC) to better simulate arbitrary terrestrial atmospheres(based on RRTM model, Mlawer et al. (1997)): • New spectral (added 1-3µm), temperature (include T<150 K) and pressure (up to 10 bar) coverage included • CO2 continuum absorption as opacity source in IR • k-distributions recalculated for CO2-enhanced background atmosphere with 5% CO2 and 95% N2 to include line broadening by carbon dioxide
Absorption coefficient k(v) Net Flux Density function Distribution function Net Flux
Validation of modified radiation scheme Validation of k-distributions for normal air background, i.e. modern Earth Example: CO2 fundamental band at 15µm RRTM (Mlawer et al. 1997) MRAC (This work)
Validation of modified radiation scheme Validation of temperature profiles calculated with RRTM and MRAC Example: present Earth, 1bar atmosphere, 78% nitrogen, 21% oxygen, 1% argon, 355ppm CO2, other gases (ozone, methane and nitrous oxide) removed Mid-stratosphere to upper mesosphere:slight disagreement due to extrapolation errors for RRTM (yielding negative optical depths) RRTM (Mlawer et al. 1997) MRAC (This work) Surface up to mid-stratosphere: excellent agreement Convective regime
Importance of T-grid for absorption coefficients For shown validation run: Calculated temperatures outside RRTMtemperature grid extrapolation is performed This yields negative absorption cross sections, in contrast to interpolation in MRAC Tabulated values MRAC RRTM Calculated values „True“ values
This work: Model runs Vary Earth age Solar constants of 0.70 ,0.75, 0.80, 0.85, 0.90, 0.95 (equivalent to times 4.6 – 0.1 Gyr ago) • Constant nitrogen background pressure of 0.77 bar • Add carbon dioxide until desired surface temperature Tsurf isreached
S=0.8 S=0.85 S=0.8 S=0.85 Results: Atmospheric structure Temperature inversion Cold trap Convective regime The structure of early Earth atmospheres differs from the present one: • The tropopause moves closer to the surface • Cold trap no longer associated with a temperature inversion • Tropopause, cold trap and temperature inversion no longer at samealtitudes
Upper limits on CO2 / (for 2 approximations of solar luminosity) Late Archaean: values of 3-4 mb compatible Results: Keeping the surface warm Tsurf= 288 K Tsurf= 273 K, from Kasting (1987) Tsurf= 273 K Minimal CO2 concentrations for 273 K (lower plain line) and 288 K (upper plain line), for comparison: values from Kasting (1987) for 273 K (dashed line)
Much less CO2 needed to keep surface of early Earth above 273K Calculated amount of CO2 (3-4 mbar) for the late Archaean and early Proterozoic is compatible with palaesol records, contrary to previous studies Atmospheric structure very different from today‘s structure Outlook: Model different evolutionary stages in the future Conclusions