Download

1 / 35
350 likes | 553 Views
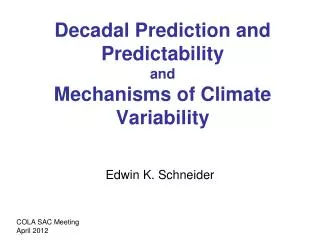
Predictability & Prediction of Seasonal Climate over North America. Lisa Goddard , Simon Mason, Ben Kirtman, Kelly Redmond, Randy Koster, Wayne Higgins, Marty Hoerling, Alex Hall, Jerry Meehl, Tom Delworth, Nate Mantua, Gavin Schmidt (US CLIVAR PPAI Panel). Potential predictability.

E N D
Predictability & Prediction of Seasonal Climate over North America Lisa Goddard, Simon Mason, Ben Kirtman, Kelly Redmond, Randy Koster, Wayne Higgins, Marty Hoerling, Alex Hall, Jerry Meehl, Tom Delworth, Nate Mantua, Gavin Schmidt(US CLIVAR PPAI Panel) NOAA 31st Annual Climate Diagnostics and Prediction Workshop
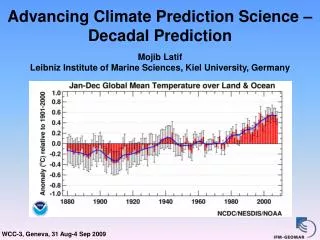
Potential predictability Research forecasts operational Time Series of Prediction Skill (Courtesy of Arun Kumar & Ants Leetmaa) (1) Understand the limit of predictability (2) Identify conditional predictability (e.g. state of ENSO or Indian Ocean) (3) Document the expected skill to judge potential utility of the information for decision support (4) Set a baseline for testing improvements to prediction tools and methodologies (5) Set a target for real-time predictions.
Real-time prediction skill…North America, 1-month lead, seasonal terrestrial climate • Provide a template for verification - What are the best metrics? Best for who? - Pros & cons of current metrics - Can we capture important aspects of variability (e.g. trends, drought periods)? • Estimate skill of real-time forecasts - How predictable is N. America climate? - Benefit of multi-model ensembling? • Provide baseline against which we can judge future advances - How best to archive/document for future comparison? - Are we missing something? (i.e. statistical models)
Forecast Data Dynamical models (single): • CCCma – Canadian Centre for Climate Modeling and Analysis • KMA – Korean Meteorological Agency • MGO- Main Geophysical Observatory, Russia • NASA/GMAO-National Aeronautics and Space Administration, USA • RPN – Canadian Meteorological Centre • ECHAM4.5 – MPI (run at IRI) • CCM3.6 – NCAR (run at IRI) • ECMWF –European Center for Medium Range Weather Forecasts • Meteo-France – Meteorological Service, France • LODYC- Laboratoire d'Océanographie Dynamique et de Climatologie, France • Met Office – UK Meteorological Office • MPI – Max Planc Institute for Meteorology, Germany • CERFACS – European Centre for Research and Advanced Training in Scientific Computing, France • INGV-Instituto Nazionale di Geofisica e Vulcanolgia, Italy • NOAA-CFS – National Oceanic Atmospheric Administration, USA Multi-Model of dynamical models (simple average) Statistical models (from CPC): CCA, OCN (others?) Multi-Model of dynamical + statistical models
Verification Data & Metrics OBSERVATIONAL DATA: 2.5x2.5 deg • 2m T: CRU-TSv2.0 (1901-2002) • Precipitation: CMAP (1979-2004) VERIFICATION MEASURES Metrics consistent with WMO - SVS for LRF (Standardised Verification System for Long Range Forecasts) • Deterministic information : - MSE & its decomposition - correlation, mean bias, & variance ratio • Probabilistic information: - Reliability diagrams, regionally accumulated - ROC areas for individual grid boxes
Mean Squared Error Pro: * Gives some estimate of uncertainty in forecast (i.e. RMSE). Con: * Can not infer frequency of large errors unless precise distributional assumptions are met. Recommendation: * Perhaps simple graph or table showing frequency of errors of different magnitudes would be appropriate.
Correlation Pros: * Commonly used; familiar * Gives simple overview of where models are likely to have skill or not Con: * Merely measure of association, not of forecast accuracy Recommendation: * Avoid deterministic metrics
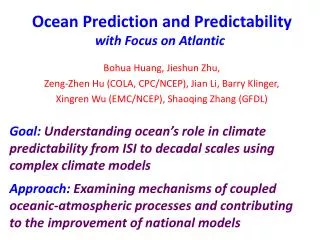
Example Ensemble forecasts of above-median March – May rainfall over north-eastern Brazil
0.9 0.8 0.7 0.6 0.5 0.4 0.3 0.2 0.1 ROC Areas : DJF TemperatureBELOW-NORMAL
0.9 0.8 0.7 0.6 0.5 0.4 0.3 0.2 0.1 ROC Areas : DJF TemperatureABOVE-NORMAL
0.9 0.8 0.7 0.6 0.5 0.4 0.3 0.2 0.1 ROC Areas : JJA TemperatureABOVE-NORMAL
0.9 0.8 0.7 0.6 0.5 0.4 0.3 0.2 0.1 ROC Areas : JJA TemperatureBELOW-NORMAL
0.9 0.8 0.7 0.6 0.5 0.4 0.3 0.2 0.1 ROC Areas : DJF PrecipitationABOVE-NORMAL
0.9 0.8 0.7 0.6 0.5 0.4 0.3 0.2 0.1 ROC Areas : DJF PrecipitationBELOW-NORMAL
0.9 0.8 0.7 0.6 0.5 0.4 0.3 0.2 0.1 ROC Areas : JJA PrecipitationABOVE-NORMAL
0.9 0.8 0.7 0.6 0.5 0.4 0.3 0.2 0.1 ROC Areas : JJA PrecipitationBELOW-NORMAL
ROC Areas Pros: * Can treat probabilistic forecasts * Can be provided point-wise * Can distinguish ‘asymmetric’ skill Cons: * Fails to address reliability
Reliability Pros: * Treats probabilistic forecasts * Relatively easy to interpret * Provides most relevant information on usability of forecast information over time Cons: * Difficult to provide for individual grid points, especially for short time samples
Temperature Trends over North America %-Area Covered by “Above-Normal”
Temperature Trends over North America %-Area Covered by “Above-Normal”
1 2 3 4 1 2 3 4 Observed Precipitation over North America1998-2001 JJA DJF Anomalies relative to1981-1997 Percent difference relative to 1981-1997 Frequency (# years out of 4)for precipitation in BN category
4 in 4 3 in 4 2 in 4 1 in 4 Frequency of Below-Normal PrecipitationJJA 1998-2001 OBSERVATIONS
4 in 4 3 in 4 2 in 4 1 in 4 Frequency of Below-Normal PrecipitationDJF 1998-2001 OBSERVATIONS
Summary • What’s an appropriate template? - Skill metrics should be flexible (i.e. user defined “events”, categories, thresholds) - Probabilistic forecasts must be treated probabilistically!!! • How are we doing? - Could be better. Encouraging performance estimates by some measures, but inadequate performance on important aspects of climate variability. - Missing elements necessary for seasonal prediction? • Baseline??