Download
1 / 42
430 likes | 620 Views
A Distributed Biosphere-Hydrological Model System for Continental Scale River Basins 大陸河川のための分布型生物圈水文モデルに関する研究. by Qiuhong Tang 7 Nov 2006 Hydro Seminar @ Land surface hydrology group of UW. Outline. ❶. ➢. Introduction. Evolution of Hydrological Modeling. ❷. Analyses on Observed Data.

E N D
A Distributed Biosphere-Hydrological Model System for Continental Scale River Basins大陸河川のための分布型生物圈水文モデルに関する研究 by Qiuhong Tang 7 Nov 2006 Hydro Seminar @ Land surface hydrology group of UW
Outline ❶ ➢ Introduction Evolution of Hydrological Modeling ❷ Analyses on Observed Data ❸ Development of a Distributed Biosphere-Hydrological Model ❹ Evaluation of the DBH Model System ❺ Long Term Change of Hydrological Cycles in the Yellow River Basin ❻ Conclusions and Recommendations ❼
The picture is adopted from Oki and Kanae Science (2006). ❶ Introduction Tang, Qiuhong 7 Nov 2006 Slide 3
❷ Evolution of Hydrological Modeling ❸ ❹ ❻ ❺ ❼ Conclusions and Recommendations ❶ Introduction Tang, Qiuhong 7 Nov 2006 Slide 4
Outline ❶ Introduction ➢ Evolution of Hydrological Modeling ❷ Analyses on Observed Data ❸ Development of a Distributed Biosphere-Hydrological Model ❹ Evaluation of the DBH Model System ❺ Long Term Change of Hydrological Cycles in the Yellow River Basin ❻ Conclusions and Recommendations ❼
Conceptual Model: The first generation hydrological model (1960s – 1970s) Use statistical relationship between rainfall and discharge Integrate different components of hydrological processes in a lumped or fake-distributedway Representative models and methodology: Stanford model, Xin’an jiang model, Tank model, Unit Hydrograph etc. Distributed Model: The second generation hydrological model (1980s – 1990s) Recognize the effects of spatial heterogeneity with spatially varying data Solve the differential equations with powerful computer Representative models and methodology: SHE model, TOPMODEL, GBHM etc. Tang, Qiuhong 7 Nov 2006 Slide 6
Distributed Biosphere-Hydrological (DBH) Model: The third generation hydrological model (2006) Connect hydrological cycle with biosphere, climate system and human society. Physically represent hydrological cycle with nontraditional data Development of DBH model shows the new direction of hydrology. Few models can represent both biosphere and land surface hydrological cycle. (e.g. DHSVM, VIC, FOREST-BGC etc.) This study will develop a model system to bridge atmosphere-biosphere-land surface hydrology and human society. The scope of hydrology will broaden from rainfall-runoff relationship to climatology, biosphere, ecosystem, geosphere, remote sensing, and human society. ❷ Evolution of Hydrological Modeling Tang, Qiuhong 7 Nov 2006 Slide 7
Outline ❶ Introduction Evolution of Hydrological Modeling ❷ ➢ Analyses on Observed Data ❸ Development of a Distributed Biosphere-Hydrological Model ❹ Evaluation of the DBH Model System ❺ Long Term Change of Hydrological Cycles in the Yellow River Basin ❻ Conclusions and Recommendations ❼
Get time series coverage from in situ observation. IDW TPS Interpolation methods: Inverse Distance Weighted (IDW) Thin Plate Splines (TPS) Thiessen Polygons (TS) TS ❸ Analyses on Observed Data Tang, Qiuhong 7 Nov 2006 Slide 9
Harmonize variant data sources. Information extracted from nontraditional data is compared with traditional data. G: Ground observation Rd: Data derived by DBH Ro: Data from CLAVR Ro Rd Satellite data Satellite data G1 G2 Data from: AVHRR NDVI dataset Spatial resolution: 16 km Temporal resolution: daily Study area: the Yellow River Basin Study period: 1995-2000 Rd G2 G1 G1 Tang, Q., Oki, T., 2006. J. Appl. Meteorol., accepted. ❸ Analyses on Observed Data Tang, Qiuhong 7 Nov 2006 Slide 10
Data analysis. I III Precipitation (%) Reference ET (%) Mean Temperature (K) Min. Temp. (K) Relative humidity (%) Sunshine time (%) Max. Temp. (K) DTR (diurnal temp. range, K) Detect climate change magnitude (1960-2000) : Precipitation on the Loess Plateau decreases Cloudy decreases, humidity decreases, temperature and ET increase, in irrigation districts (Drier). LAI increase in irrigation districts. II III Cloud amount (%) LAI (%) Temperature increases, LAI decreases on the Tibet Plateau The Loess Plateau, the IDs, and the Tibet Plateau can be precipitation, human activity, and temperature hot spots of Yellow River drying up, respectively. Tang, Q., Oki, T., Kanae, S., Hu, H., 2006. Hydrol. Process., accepted. ❸ Analyses on Observed Data Tang, Qiuhong 7 Nov 2006 Slide 11
Outline ❶ Introduction Evolution of Hydrological Modeling ❷ Analyses on Observed Data ❸ ➢ Development of a Distributed Biosphere-Hydrological Model ❹ Evaluation of the DBH Model System ❺ Long Term Change of Hydrological Cycles in the Yellow River Basin ❻ Conclusions and Recommendations ❼
DBH model strategy One dimensional model (Hydrotopes) River Routing Scheme http://hydro.iis.u-tokyo.ac.jp/DBH/ Tang, Q., Oki, T., Hu, H., 2006. Ann. J. Hydraul. Eng. JSCE 50, 37-42. ❹ Development of a DBH Model Tang, Qiuhong 7 Nov 2006 Slide 13
New features of DBH model: Biosphere, Nontraditional data sources. ❹ Development of a DBH Model Tang, Qiuhong 7 Nov 2006 Slide 14
New features of DBH model: Biosphere, Nontraditional data sources. Global Climate Stations SiB2 Land Use Data sources used in the DBH model system: Remote sensing (RS) : AVHRR/NDVI, LAI, FPAR, ISCCP-FD RadFlux, HYDRO1K, etc. Ground observations: Global Surface Summary of Day Data, Global Soil Bank, etc. Statistical survey data: Global Soil Map, Global Irrigation Area AVHRR / LAI ❹ Development of a DBH Model Tang, Qiuhong 7 Nov 2006 Slide 15
Outline ❶ Introduction Evolution of Hydrological Modeling ❷ Analyses on Observed Data ❸ Development of a Distributed Biosphere-Hydrological Model ❹ Evaluation of the DBH Model System ➢ ❺ Long Term Change of Hydrological Cycles in the Yellow River Basin ❻ Conclusions and Recommendations ❼
DBH model application in the Yellow River Basin The Yellow River Basin Area: 794,712 km2 River length: 5,464 km Topographic condition: Tibetan Plateau – Loess Plateau – North China Plain Climatic Condition: Annual precipitation < 200 – 800 mm Simulation: Spatial: 10*10 km; Time step: hourly; ❺ Evaluation of the DBH Model System Tang, Qiuhong 7 Nov 2006 Slide 17
Model Calibration and Validation Monthly discharge comparison Bias = -1.1% RMSE = 233 m3/s RRMSE = 0.3 MSSS =0.828 MSSS (mean square skill score, Murphy, 1988, recommended by WMO) MSSS: -∞ To 1.0 Calibration (1983-1993) Slope: FAO soil map, slope f=2.0 Monthly discharge comparison Bias = -6% RMSE = 333 m3/s RRMSE = 0.48 MSSS =0.646 Validation (1962-1982) ❺ Evaluation of the DBH Model System Tang, Qiuhong 7 Nov 2006 Slide 18
Model Calibration and Validation Averaged Monthly discharge comparison Calibration (1983-1993) Daily discharge comparison Bias = -1.1% RMSE = 136 m3/s RRMSE = 0.2 MSSS =0.923 Annual Largest Flood Peak comparison (m3/s, day) Bias = -1.1% RMSE = 297 m3/s RRMSE = 0.4 MSSS =0.759 Validation (1962-1982) Daily discharge comparison Bias = -6% RMSE = 459 m3/s RRMSE = 0.6 MSSS =0.419 Bias > 50% Tdelay > 5 days Bias < 10% ❺ Evaluation of the DBH Model System Tang, Qiuhong 7 Nov 2006 Slide 19
Model Calibration and Validation Calibration (1980s-1990s) Unit: 106m3/ year Canal coefficient: 0.3 Validation (1960s-1970s) Unit: 106m3/ year The canal coefficient in Yellow River basin is about: 0.3 – 0.5. (Wang H., Cai P., Zhou H. Yellow River News, YRCC, 2005) ❺ Evaluation of the DBH Model System Tang, Qiuhong 7 Nov 2006 Slide 20
Target: Effects of natural and anthropogenic heterogeneity • Review of studies on this topic: • Effect of natural, not anthropogenic, heterogeneity is presented. • The new generation hydrological model makes it possible to represent both natural and anthropogenic heterogeneity. Methodology: Anthropogenic heterogeneity Precipitation heterogeneity Calibrate with Tangnaihai station a=b=4 withdraw from specific river section Precipitation withdraw from nearest river section Irrigated Fraction data is from AQUASTAT dataset. Area Experiments: Case 1 : no irrigation, no precipitation heterogeneity Case 2 : no irrigation, with precipitation heterogeneity Case 3 : irrigation, with precipitation heterogeneity Tang, Q., Oki, T., Kanae, S., Hu, H., 2006. J. Hydromet., accepted. ❺ Evaluation of the DBH Model System Tang, Qiuhong 7 Nov 2006 Slide 21
(RAZ) Results: Case 1 : no precipitation heterogeneity Case 2 : with precipitation heterogeneity With consideration of natural heterogeneity, total runoff increase because surface runoff increase. Case 2 : no irrigation Case 3 : with irrigation With consideration of anthropogenic heterogeneity, Runoff Absorbing Zone (RAZ) can be simulated. 41% discharge increases 59% decreasing discharge ❺ Evaluation of the DBH Model System Tang, Qiuhong 7 Nov 2006 Slide 22
Effects of human activities on water components: Annual mean water components (1983-2000) in the Yellow River Basin AVG ID IF3 MAX MIN AVG ID IF3 MAX MIN Irrigation Water shortage 65% 42% 44% 100% 0% 1.9 7.7 11.7 37.1 0 AVG ID IF3 MAX MIN AVG ID IF3 MAX MIN -0.25 0.8 1.2 26.4 -8.6 2.1 6.9 10.5 22 0 Evaporation increase Runoff increase Averaged (AVG) In Irrigation Districts (ID) Irrigated Fraction>0.3(IF3) MAX MIN ❺ Evaluation of the DBH Model System Tang, Qiuhong 7 Nov 2006 Slide 23
Effects of human activities on energy components: Mean energy components in peak irrigation month (JJA, 1983-2000) AVG ID IF3 MAX MIN AVG ID IF3 MAX MIN -0.1 -0.32 -0.4 0 -1.6 -0.06 -0.23 -0.31 0 -1.2 Canopy temperature change Ground temperature change AVG ID IF3 MAX MIN AVG ID IF3 MAX MIN -2.5 -.7.7 -10.2 0 -37.8 3.3 11.2 15.5 43.3 0 Latent heat fluxes change Sensible heat fluxes change Averaged (AVG) In Irrigation Districts (ID) Irrigated Fraction>0.3(IF3) MAX MIN ❺ Evaluation of the DBH Model System Tang, Qiuhong 7 Nov 2006 Slide 24
Outline ❶ Introduction Evolution of Hydrological Modeling ❷ Analyses on Observed Data ❸ Development of a Distributed Biosphere-Hydrological Model ❹ Evaluation of the DBH Model System ❺ ➢ Long Term Change of Hydrological Cycles in the Yellow River Basin ❻ Conclusions and Recommendations ❼
A comprehensive application (Both data analysis and model simulation) Study area: the Yellow River Basin (1960-2000) Target: potential reasons for the Yellow River drying up Review of studies on this topic: • Analyze hydro-climate data (Fu et al 2004; Yang et al 2004, Xu 2005) • Analyze water use/irrigation data (Liu and Zhang 2002) • Statistical relationship between climate data, water use, and discharge data The new generation hydrological model makes it possible to numerically simulate connections (internal relation) between climate condition, human activity and hydrology cycle. DBH Climate condition Hydrology cycle Human activity Distributed Numerical ❻ Long Term Change of Hydrological Cycles in YRB Tang, Qiuhong 7 Nov 2006 Slide 26
Methodology: To watch the hydrological response to hydrological forcing data. The simulation difference between ‘no change’ and ‘change’ forcing data shows the contribution of the hydrological components. Irrigated area change/ no change The distribution of irrigated area data is from AQUASTAT dataset. The amount of irrigated area is obtained from reports or literatures. ❻ Long Term Change of Hydrological Cycles in YRB Tang, Qiuhong 7 Nov 2006 Slide 27
Climate conditions linear change/ no linear change (mean value is the mean value of the 1960s) / no pattern change Precipitation Mean Temp. Min. Temp. Max. Temp. Climate conditions without pattern change (repeat the climate condition in the 1960s) Sunshine time Relative Humidity ❻ Long Term Change of Hydrological Cycles in YRB Tang, Qiuhong 7 Nov 2006 Slide 28
Vegetation conditions change / no change LAI FPAR Experiments: S1-S2: linear climate change contribution S1-S3: vegetation change contribution S1-S4: irrigated area change contributions S1-S5: all linear changes contribution (S1-S5) – (S1-S6): climate pattern change contribution ❻ Long Term Change of Hydrological Cycles in YRB Tang, Qiuhong 7 Nov 2006 Slide 29
Results: Model performance of annual discharge at main stem stations of the Yellow River MSSS = 0.5 MSSS = 0.5 MSSS = 0.7 MSSS = 0.7 Simulated and reported water withdrawals at the Yellow River basin Scenario 1 ❻ Long Term Change of Hydrological Cycles in YRB Tang, Qiuhong 7 Nov 2006 Slide 30
Results: Runoff_Change ET_Change Withdrawal_Change Tg_Change Hydrological components change contributed by climate, vegetation, irrigated area change. (S1-S5) ❻ Long Term Change of Hydrological Cycles in YRB Tang, Qiuhong 7 Nov 2006 Slide 31
Conclusion Remarks: 1) Climate change (75%) is dominated in upper/middle reaches, human activity is dominated in lower reaches. 2) Climate pattern change (30%) rather than linear change (10%) is more important for Yellow River drying up. 3) The reservoirs make more stream flow consumption for irrigation on one hand, and help to keep environment flow and counter zero-flow in the river channel on the other hand. Tang, Q. et al, 2006. xxx, xxx (manuscript ready for submission). ❻ Long Term Change of Hydrological Cycles in YRB Tang, Qiuhong 7 Nov 2006 Slide 32
Outline ❶ Introduction Evolution of Hydrological Modeling ❷ Analyses on Observed Data ❸ Development of a Distributed Biosphere-Hydrological Model ❹ Evaluation of the DBH Model System ❺ Long Term Change of Hydrological Cycles in the Yellow River Basin ❻ Conclusions and Recommendations ➢ ❼
Conclusions 1) A new generation hydrological model, DBH model, is developed and validated. 2) Spatial distribution of land characteristics and climate features can be captured by the DBH model with nontraditional datasets. 3) The new generation model can demonstrate the effects of natural and anthropogenic heterogeneity. Accounting for anthropogenic heterogeneity can simulate negative runoff contribution which cannot be represented by traditional models. 4) The DBH model was used to interpret the potential reasons for the Yellow River drying up. Climate change is dominated in upper/middle reaches, human activity is dominated in lower reaches. Climate pattern change rather than linear change is more important. ❼ Conclusions and Recommendations Tang, Qiuhong 7 Nov 2006 Slide 34
Recommendations 1) Data collection efforts would continuously benefit research on land surface hydrology. Hydrologists should improve communications with data maker community. 2) Model validation is needed for the new generation model. Data on the chemical composition of water can be used for modeling water flow paths. 3) Further, the model can extend to simulate hydrological cycle over the global land surface with global datasets. The ocean-land surface-atmosphere model system will explore and variability and predictability of climate and hydrological variations. 4) With the consideration of climate, biosphere, land surface hydrology and human activity, the new generation model has potential great societal benefits. The development and application of the new model will benefit both science and society. ❼ Conclusions and Recommendations Tang, Qiuhong 7 Nov 2006 Slide 35
Hydro Seminar @ Land surface hydrology group of UW http://hydro.iis.u-tokyo.ac.jp/DBH/
Publications (Accepted and Published): Tang, Q., Oki, T., Hu, H., 2006. A distributed biosphere hydrological model (DBHM) for large river basin. Ann. J. Hydraul. Eng. JSCE 50, 37-42. Tang, Q., Oki, T., 2006. Daily NDVI relationship to cloud cover. J. Appl. Meteorol., accepted. Tang, Q., Oki, T., Kanae, S., Hu, H., 2006. The influence of precipitation variability and partial irrigation within grid cells on a hydrological simulation. J. Hydromet., accepted. Tang, Q., Oki, T., Kanae, S., Hu, H., 2006. A spatial analysis of hydro-climatic and vegetation condition trends in the Yellow River Basin. Hydrol. Process., accepted. Tang, Q., Hu, H., Oki, T., Tian, F., 2006. Water balance within intensively cultivated alluvial plain in an arid environment. Water Resource Management., accepted. Tang,Q., Hu, H., Oki, T., 2006. Groundwater recharge and discharge in a hyperarid alluvial plain (Akesu, Taklimakan Desert, China), Hydrological Processes, accepted. Tang, Q., Hu, H., and Oki, T., Hydrological processes within an intensively cultivated alluvial plain in an arid environment, Sustainability of Groundwater Resources and its Indicators (Pro- ceedings of symposium S3 held during the Seventh IAHS Scientific Assembly at Foz do Iguacu, Brazil, April 2005). IAHS Publ. 302, 2006. Tang, Q., Tian, F., and Hu, H., Runoff-evaporation hydrological model for arid plain oasis II: the model application, Shuikexue Jinzhan/Advances in Water Science, 15 (2): 146-150, 2004. (in Chinese with English abstract) Hu, H., Tang, Q., Lei, Z., and Yang, S., Runoff-evaporation hydrological model for arid plain oasis I: the model structure, Shuikexue Jinzhan/Advances in Water Science, 15 (2): 140-145, 2004. (in Chinese with English abstract)
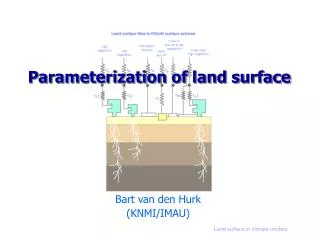
Land Surface Model Groundwater-soil water transfer: Relationship between soil moisture potential and soil moisture: (Clapp and Hornberger, 1978)
Groundwater-River Interaction Groundwater flow to a ditch over a sloping impermeable bed. Assuming that the flow lines are approximately parallel to the bed, according to the Dupuit-Forchheimer approximation, the flow of water per unit width of the river is estimated. (Childs, 1971; Towner, 1975)
Overland flow on the Hillslope Flow in river channel
Model Validation Criteria Mean Error: Relative Bias: Mean Absolute Error: Mean square error: Relative RMSE: Mean Square Skill Score: (Murphy, 1988) Recommended by WMO.