
EXAMPLE 1
Learn how to graph the equation of a translated circle by plotting the center and points that are 3 units away from the center. Draw the circle passing through the points.

EXAMPLE 1
E N D
Presentation Transcript
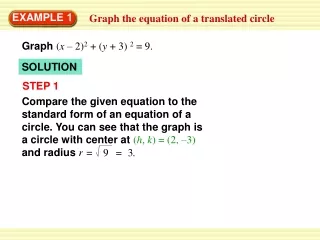
Compare the given equation to the standard form of an equation of a circle. You can see that the graph is a circle with center at (h, k) = (2, –3)and radius r= = 3. 9 EXAMPLE 1 Graph the equation of a translated circle Graph(x – 2)2 + (y + 3) 2 = 9. SOLUTION STEP 1
EXAMPLE 1 Graph the equation of a translated circle STEP 2 Plot the center. Then plot several points that are each 3units from the center: (2 + 3, –3) = (5, –3) (2 – 3, –3) = (–1, –3) (2, –3 + 3) = (2, 0) (2, –3 – 3) = (2, –6) STEP 3 Draw a circle through the points.
(y – 3)2 (x + 1)2 4 9 EXAMPLE 2 Graph the equation of a translated hyperbola Graph – = 1 SOLUTION STEP 1 Compare the given equation to the standard forms of equations of hyperbolas. The equation’s form tells you that the graph is a hyperbola with a vertical transverse axis. The center is at (h, k) = (–1, 3). Because a2 = 4 and b2 = 9, you know that a = 2 and b = 3.
Plot the center, vertices, and foci. The vertices lie a = 2 units above and below the center, at (–1, 5)and (–1, 1). Because c2 = a2 + b2 = 13, the foci lie c = 13 3.6 units above and below the center, at (–1, 6.6)and (–1, –0.6). EXAMPLE 2 Graph the equation of a translated hyperbola STEP 2
EXAMPLE 2 Graph the equation of a translated hyperbola STEP 3 Draw the hyperbola. Draw a rectangle centered at (–1, 3)that is 2a = 4 units high and 2b = 6 units wide. Draw the asymptotes through the opposite corners of the rectangle. Then draw the hyperbola passing through the vertices and approaching the asymptotes.
for Examples 1 and 2 GUIDED PRACTICE 1. Graph(x + 1)2 + (y – 3) 2 = 4. SOLUTION circle with center at (h, k) = (– 1, 3)and radius r=2
for Examples 1 and 2 GUIDED PRACTICE 2. Graph(x – 2)2 = 8 (y + 3) 2. SOLUTION parabola with vertex at (2, –3) ,focus (2, –1)and directrix y=–5
(y – 4)2 9 for Examples 1 and 2 GUIDED PRACTICE 3. Graph (x + 3)2 – = 1 SOLUTION hyperbola with vertices (–4, 4) and (–2, 4), asymtotes y = –2x – 2 and y = 2x + 10
(y – 1)2 9 for Examples 1 and 2 GUIDED PRACTICE (x – 2)2 4. Graph + = 1 16 SOLUTION Ellipse with center (2, 1), vertices (6, 1) and (–2,1) and co–vertices (2, 4) and (2, –2)


