Download
1 / 17
170 likes | 188 Views
This document discusses the implementation of the Affordable Care Act, including working with states, coordinating with federal agencies, and listening to stakeholders. It also covers eligibility levels, cost distribution, fiscal pressures, concentration of spending, and efforts to reduce costs and improve care.

E N D
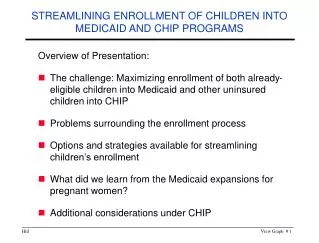
Medicaid and CHIP: On the Road to Reform Cindy Mann, JD CMS Deputy Administrator Director Center for Medicaid, CHIP and Survey & Certification Centers for Medicare & Medicaid Services Alliance for Health Reform/Kaiser Family Foundation March 4, 2011
Implementing the Affordable Care Act • Working with States (Governor’s offices, Medicaid, CHIP, Insurance Commissioners) • Coordinating with the Center for Consumer Information and Insurance Oversight (CCIIO), IRS/Treasury, other federal agencies • Listening to what reform means to a broad array of stakeholders • Promulgating regulations and guidance; providing technical assistance
Sources of Coverage by 2019 for Individuals Under 65 24m 51m 23m 25m 159m Source: Congressional Budget Office, March 2010
New Paradigm Medicaid/ CHIP Employer Coverage Exchange • Not a safety net but a full partner in assuring coverage, quality and cost containment • Simplified rules and process (eligible = enrolled) • A system of coverage and care
66% Percentage of Population Under 133% of the FPLUninsured vs. Medicaid Covered 42% 43% 35% 23% 17% Source: HHS ASPE analysis of the 2010 Annual Social and Economic Supplement to the Current Population Survey
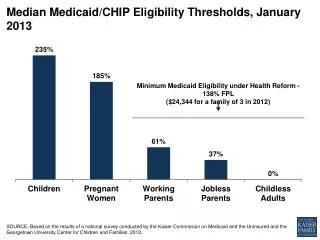
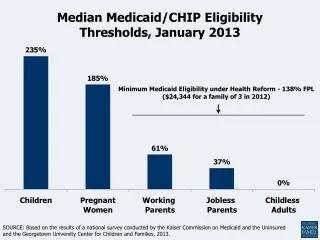
Minimum Medicaid Eligibility LevelsNow and 2014 Average - Will vary by State * 5 States provide Medicaid or Medicaid look-alike coverage to certain childless adults; 15 States provide a limited benefit package to certain childless adults.
400% FPL Exchange Subsidies 2014 Health Insurance Subsidies 241% FPL Medicaid/CHIP Children Varies by State 133% FPL Medicaid Adults 0 Adults Children
First Steps:Modernized, Efficient Systems • IT Guidance 1.0 for Medicaid and the Exchange • NPRM on Medicaid Eligibility Systems • 90% FFP for eligibility and enrollment system design and development until 12/31/15 • 75% FFP for system maintenance • Established 7 Conditions & Standards • 7 Exchange Innovator Grants and Collaborative
Who Pays? Estimated Distribution of Costs for Medicaid Coverage Changes: 2014-2019 (in billions) Total $464.7 billion Source: Congressional Budget Office and Medicaid Coverage and Spending in Health Reform, John Holahan and Irene Headen/Kaiser Commission, May 26, 2010
Current Fiscal Pressures • Enrollment among families and children has grown sharply due to the recession • Medicaid is intended to be a countercyclical program • Despite enrollment growth, state Medicaid spending declined during the recession • The Recovery countercyclical FMAP increase resulted in a 10% drop in state spending on Medicaid in 2009 • While enrollment growth explains recent growth in costs, the real cost drivers lie elsewhere
Concentration of Medicaid Spending 1% 5 % 54% Percentile of Medicaid Population (Ranked by Spending) 10% Percent of Total Medicaid Spending 95% 50% 5% 0% 20% 40% 60% 80% 100% Source: Medicaid Statistical Information System Claims Data for FY 2008
Coverage: Pathway to Better Care, Better Health, Lower Costs Population Health Per Capita Cost Experience Of Care
What CMS is Doing to Help States Reduce Costs Now • Focus on Medicaid Cost Drivers • Existing Authority & New Initiatives • Benefits & Cost-Sharing • Integrated Care for High-Cost Beneficiaries; improving care transitions; reducing unnecessary hospitalizations • Purchasing Drugs More Efficiently • Assuring Program Integrity • Working individually with States (“MSTAT”)
Health Care Expenditures $7,464 Average Cost of One Hospital Admission for a Non-Dual Disabled Medicaid Enrollee Annual Cost of Providing Health Coverage to One Parent under Medicaid Source: CMS data analysis and Urban Institute analysis of data from MSIS and CMS Form 64, prepared for Kaiser Commission on Medicaid and the Uninsured, 2010. Kaiser Family Foundation-State Health Facts, FY 2007.
Duals as Share of Medicaid Spending Dual Eligibles 39% Non-Duals 61% Focus on Dual Eligibles Non-Disabled Adults Children Duals Total Spending = $311 billion Source: CMS data and Urban Institute analysis of data from MSIS and CMS Form 64, prepared for Kaiser Commission on Medicaid and the Uninsured, 2010. Kaiser Family Foundation-State Health Facts, FY 2007.
Achieving a High Performing Medicaid Program • States and the Federal Government working together to achieve: • Simplified, accurate, customer-friendly, data driven eligibility/renewal processes that are fully coordinated with the Exchange • Eligible = Enrolled • Access to person-centered, high quality, integrated care with options for continuity of coverage with plans on the Exchange • Continuing quality and cost improvement in our health care system, based on consumer and other stakeholder input, data, and collaboration.