Download
1 / 9
90 likes | 259 Views
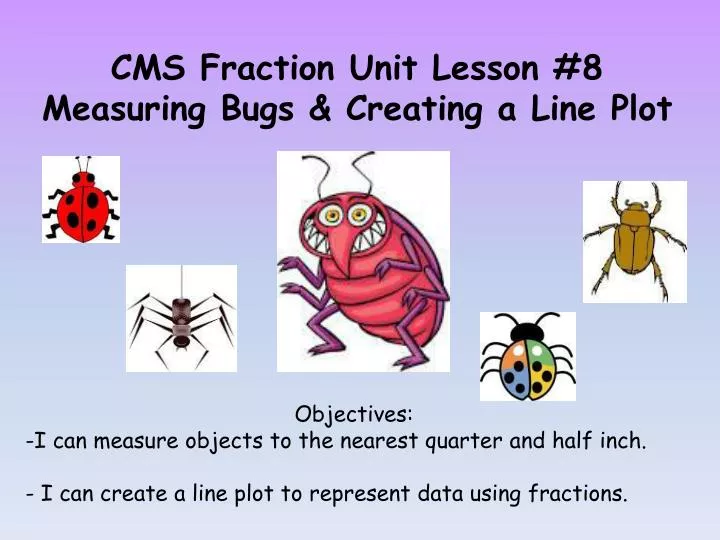
CMS Fraction Unit Lesson #8 Measuring Bugs & Creating a Line Plot. Objectives: I can measure objects to the nearest quarter and half inch. - I can create a line plot to represent data using fractions. Measuring Review. http://www.studyzone.org/testprep/math4/d/inch4l.cfm

E N D
CMS Fraction Unit Lesson #8Measuring Bugs & Creating a Line Plot Objectives: I can measure objects to the nearest quarter and half inch. - I can create a line plot to represent data using fractions.
Measuring Review • http://www.studyzone.org/testprep/math4/d/inch4l.cfm • http://www.funbrain.com/measure/ - Choose medium inches
Measuring Bugs • You will be measuring the length of the bugs to the nearest half and fourth of an inch. You will decide whether you should measure to the nearest half or fourth an inch based on which the bug is closest to. You will rotate around the room to different bugs. After you measure record your findings on your recording sheet. This will go on the right side of your notebook.
Left Side: • You will create a line plot using the data you have collected. • Include a title for your graph • Draw a line plot • Create 3 questions to go with your line plot and answer them. Example: How many bugs were longer than 3 ½ inches?
Left Side: Create a Line Plot with Your Data What is a line plot? • A line plot is a graph that shows frequency of data along a number line. It is best to use a line plot when comparing fewer than 25 numbers. It is a quick, simple way to organize data.ine plot?
Check your answers… The bugs measure… • ¼ inch: red ant, housefly • ½ inch: honey bee, lady bug • ¾ inch: mosquito, field grasshopper, three-lined hoverfly • 1 ¼ inches: mayfly • 1 ½ inches: praying mantis, dragonfly, katydid • 2 ½ inches: daddy long leg • 3 ½ inches: yellow cellar slug • 4 ½ inches: goliath beetle
Exit Ticket Directions: Measure each bug to the nearest half or quarter inch.