Download
1 / 55
550 likes | 665 Views
Correlogram Method for comparing Bio-Sequences . Gandhali Samant , M.S. Computer Science. Committee Dr. Debasis Mitra, PhD Dr. William Shoaff, PhD Dr. Alan Leonard, PhD. What is Sequence Comparison.

E N D
Correlogram Method for comparing Bio-Sequences • Gandhali Samant , M.S. Computer Science Committee Dr. Debasis Mitra, PhD Dr. William Shoaff, PhD Dr. Alan Leonard, PhD
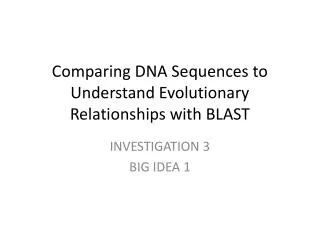
What is Sequence Comparison • Sequence Comparison – One of the most important primitive operations in computational biology. • Finding resemblance or similarity between sequences • Basis for many other more complex manipulations. • Used for database search, phylogeny development, clustering etc.
What is Sequence Comparison …Contd. • Two important notions are - • Similarity – How similar are the two sequences? This gives a numeric score of similarity between two sequences A G T C T C A T T G T C -------------------------- 1 -1 1 -1 1 1 = 2 • Alignment – Way of placing one sequence above other to make clear the correspondence between them. A G T C G T C A _ T C _ T C -------------------------- 1 -2 1 1 -2 1 1 = 1
What is Sequence Comparison …Contd. • Many methods have been proposed for sequence comparison. • Some Important ones include – • Dynamic programming algorithms for sequence alignment - Global, Local or Semi-Global Alignment • Heuristic and Database Search Algorithms - BLAST, FASTA.
What is Sequence Comparison …Contd. • Multiple sequence alignment Algorithms • Multiple sequence alignment methods are mainly used when there is a need to extract information from a group of sequences. • Examples of situations in which these techniques are used include the determination of secondary or tertiary structures, characterization of protein families, identification of similar regions etc.
What is Sequence Comparison …Contd. • Also many miscellaneous techniques have been proposed for sequence comparison • Contact based sequence alignment • Using Correlation Images • Some methods have been proposed without using the fundamental tool of Sequence Alignment • Shortest unique substring
Background Study • Basic Concepts of Molecular Biology • BLAST • Clustering • Phylogeny Trees / Phylip
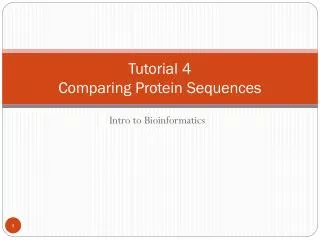
Basic Concepts of Molecular Biology • Proteins – • Most substances in our body are proteins • Some of these are structural proteins and some are enzymes. • Proteins are responsible for what an organism is and what it does in physical sense. • Amino Acids – • A protein is a chain of simple molecules called Amino Acids. There are total 20 amino acids
Basic Concepts of Molecular Biology • Nucleic Acids – • Nucleic Acids encode information necessary to produce proteins • They are responsible for passing recipe to subsequent generations. • 2 types of nucleic acids present in living organisms, • RNA (ribonucleic acid) • DNA (deoxyribonucleic acid).
BLAST • BLAST (Basic Local Alignment Search Tool) • BLAST algorithms are heuristic search methods • This method seeks words of length W (default=3 in blastP) that score at least T when aligned with the query and scored with the substitution matrix (e.g. PAM)
Clustering • Clustering • It can be defined as “The process of organizing objects into groups whose members are similar in some way”
Phylogeny Trees / Phylip • Phylogeny -The context of evolutionary biology • Phylogeny Trees • Relationships between different species and their common ancestors shown by constructing a tree. • PHYLIP, the Phylogeny Inference Package, is a package of programs for inferring phylogenies (evolutionary trees) from University of Washington . • What Phylip can do?? • Data used by phylip.
Phylip…Contd. • Following are the programs used from Phylip package in this research. • FITCH - Estimates phylogenies from distance matrix data. • KITCH - Estimates phylogenies from distance matrix data. • NEIGHBOR - Produces an un-rooted tree • DRAWGRAM - Plots rooted phylogenies, cladograms, circular trees and phenograms in a wide variety of user-controllable formats. The program is interactive. • DRAWTREE - Similar to DRAWGRAM but plots unrooted phylogenies.
D 3 2 1 0 A T G C A T G C Our Approach …Correlogram • What is a Correlogram?? • Representation of sequence in mathematical space. • 3-D matrix of which 2 dimensions are the set of entities (e.g.. Amino Acids, Nucleic Acids) and third dimension is distance.
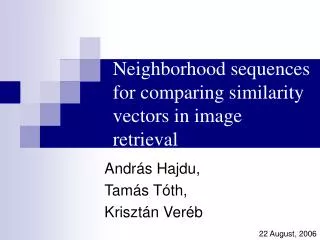
Correlogram for Image Comparison • Correlogram method has already been used for Image comparison. “Image indexing using color correlograms” By Jing Huang,S Ravi Kumar, Mandar Mitra, Wei-Jing Zhu, Ramin Zabih • A color correlogram expresses how the spatial correlation of pairs of colors changes with the distance • Color correlogram has also been used recently for object tracking
Correlogram Usage in the field of Bioinformatics • Correlograms were used to analyze autocorrelation characteristics of active polypeptides. • MF Macchiato, V Cuomo and A Tramontano (1985), “Determination of the autocorrelation orders of proteins” • For analyzing spatial patterns in various experiments. • Giorgio Bertorelle and Guido Barbujanit (1995), “Analysis of DNA Diversity by Spatial Auto Correlation” • In studies regarding patterns of transitional mutation biases within and among mammalian genomes • Michael S. Rosenberg, Sankar Subramanian, and Sudhir Kumar (2003), “Patterns of Transitional Mutation Biases Within and Among Mammalian Genomes”
Constructing a Correlogram plane • Example • Sequence ….. agcttactgt • If we calculate the appearance of every pair of characters at distance 1 .. • The Correlogram Plane for distance 1 will be -> • Correlogram can be constructed as a set of frequencies for different distances. d = 1
Constructing a Correlogram plane…Contd. • Example • Sequence ….. agcttactgt • Correlogram plane for d=0 d = 0
Constructing a Correlogram plane…Contd. • Example • Sequence ….. agcttactgt • Correlogram plane for d=2 d = 2
Graphical Representation of Correlogram • Correlogram plane shown here is of a protein sequence for distance 0. • At distance 0 each character is compared with itself so we can see all the peaks at diagonal. • This is a Histogram.
Graphical Representation …Contd. • Similarly Correlogram frequencies for distance 1 and distance 2 can be represented as…
Normalization of Correlogram • Need for normalization – Finding similarity between sequences of different length. • For every correlogram plane, each value is divided by the total volume of that plane.
1 0.5 0.5 0.25 0.25 d -> 2 3 4 5 6 Extension - Gapped Correlogram • Gapped Correlogram - Consideration the gapped alignment of sequences • The reason is if a pair of character is at distance d, there is probability that in other sequence it might appear at distance d-1 or d+1. • Adding a ‘delta’ to Correlogram. For every pair at distance n, frequency f and with delta = d, a fraction of frequency f/(2|n-distance|) is added at distances n-1,n-2… n-d and distances n+1,n+2… n+d.
Extension - Gapped Correlogram…Contd. D=2 Delta = 1 D=3 D=4 Adding values to previous plane Adding values to next plane
Correlogram for Sequence Comparison • We are using these Correlograms for comparison of 2 sequences. • Correlograms were constructed using same set of distances for both the sequences being compared. • Then distance between each cell of two Correlograms (i.e. Two 3-D Matrices) is calculated as dijk = (Sijk – S’ijk )2 / (1+ Sijk + S’ijk ) where i, j and k are 3 dimensions. • These distances were then added to get a final distance between two sequences. d = √ ∑ dijk • One major difference !!
Synthetic Data Experiments using Correlogram • Purpose • To discriminate and compare the capability of correlogram-method with one of the "traditional" comparison techniques i.e. Smith-Waterman Dynamic Programming algorithms. • The reason for using DP algorithms for comparison was that they are the most standard method for sequence comparison. • The sequences used in these experiments were amino acid sequences
Synthetic Data Experiments…Contd. • In all the experiments, the pair of sequences was compared using both Correlogram method and DP Method.
Synthetic Data Experiments…Contd. • The experiments were designed as follows • Comparing a base sequence with its reverse sequence • Wrap around the target sequence at different character length and measure the difference with respect to the reference sequence each time • Delete an amino acid from target sequence and measure the difference with respect to the reference sequence each time • Replace an amino acid at different location and measure the difference with respect to the reference sequence each time • Add an amino acid from target sequence and measure the difference with respect to the reference sequence each time
Synthetic Data Experiments…Contd. • Comparing a base sequence with its reverse sequence.
Synthetic Data Experiments…Contd. • Wrap around the target sequence at different character length and measure the difference with respect to the reference sequence each time.
Synthetic Data Experiments…Contd. • Delete an amino acid from target sequence and measure the difference with respect to the reference sequence each time.
Synthetic Data Experiments…Contd. • Replace an amino acid at different location and measure the difference with respect to the reference sequence each time.
Synthetic Data Experiments…Contd. • Add an amino acid at different location and measure the difference with respect to the reference sequence each time.
Finding Test data.. • “Alternate circulation of recent equine-2 influenza viruses (H3N8) from two distinct lineages in the United States” By Alexander C.K. Lai, Kristin M. Rogers, Amy Glaser, Lynn Tudor, Thomas Chambers • hemagglutinin (HA) gene from Different strains of equine-2 influenza viruses. • GeneTool version 1.1. – Compilation and analysis • Phylogenetic analysis was performed by using the deduced HA1 amino acid sequence and the PHYLIP software package • Distance matrix was calculated by using the PROTDIST program, and an unrooted tree generated by using the FITCH program.
Experiment 1 : Using same Test data • We have done an experiment with the same test data. • All the protein sequences were searched. http://www.ebi.ac.uk/cgi-bin/expasyfetch • A distance matrix was created using correlogram distances for every pair among these sequences. • From this distance matrix, a tree is created using PHYLIP software package. • The program ‘FITCH’ is used for creating tree whereas the program ‘DRAWTREE’ is used for visualizing the tree.
Experiment 2 : Finding Test Data • Parvovirus causes stomach diseases in children. • Coat protein – Some coat proteins are important as they are responsible for the resistance. • Different strains of parvoviri were studied for their VP1 Protein. • Reference for the test data – Dr. Mavis McKenna and Dr. Rob McKenna from University of Florida, Gainesville. • From these distance matrices, trees were created using PHYLIP software package. • The programs ‘NEIGHBOR’ and ‘DRAWTREE’ were used.
Pattern A T C G T A T C G A T C G T T A G C T C C Target 1st Comparison Last Comparison Experiment 3 -Correlogram for Sequence Scanning • The next experiment was to use correlogram for scanning Sequences i.e. Pattern Finding. • The algorithm Scan Correlogram was developed for finding the occurrences of a given pattern over a long sequence. 2nd Comparison
Experiment 3 -Correlogram for Sequence Scanning…Contd. • Following Viruses were used in this experiment • Porcine-parvovirus • Bovine Parvovirus • CPV Packaged Strand • H1 Complementary • MVM Packaged Strand • PhiX-Genome • AAV NC001401 • AAV Complementary • ADV Complementary • Astell and Tattersall MVMi Packaged Sequence
Experiment 3 -Correlogram for Sequence Scanning…Contd. • The patterns searched were as follows • ACACCAAAA • ATACCTCTTGC • ATCCTCTATCAC
Results for Bovine Parvovirus • Following are the results shown for Bovine Parvovirus. • The length of sequence was 5517 and cut-off score used was 2.48 for all three patterns.
Results for Bovine Parvovirus • Following are the results shown for Bovine Parvovirus for pattern ACACCAAAA.
Conclusions?? • This research developed the correlogram comparison method for comparing sequences. Experiments were performed on real sequences and on synthetic sequences to answer the research questions of whether the correlogram biological sequences. • It was observed that the Dynamic Programming method was more sensitive to the positioning of characters (i.e. amino acids or nucleic acids) in the sequence (sequence alignment), whereas the Correlogram method was found to be more sensitive to the character itself (contents of the sequence)