Download
1 / 33
330 likes | 492 Views
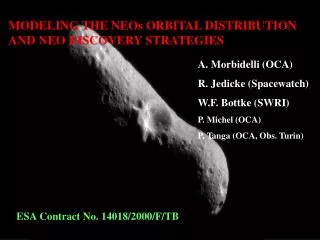
MODELING THE NEOs ORBITAL DISTRIBUTION AND NEO DISCOVERY STRATEGIES. A. Morbidelli (OCA) R. Jedicke (Spacewatch) W.F. Bottke (SWRI) P. Michel (OCA) P. Tanga (OCA, Obs. Turin). ESA Contract No. 14018/2000/F/TB. ASTEROIDS CAN ESCAPE FROM THE MAIN BELT AND BECOME NEOs.

E N D
MODELING THE NEOs ORBITAL DISTRIBUTION AND NEO DISCOVERY STRATEGIES A. Morbidelli (OCA) R. Jedicke (Spacewatch) W.F. Bottke (SWRI) P. Michel (OCA) P. Tanga (OCA, Obs. Turin) ESA Contract No. 14018/2000/F/TB
By numerically integrating the dynamics of a large number of particles we can quantify the statistics of the orbital evolutions
WE HAVE DEVELOPED A NEO DISTRIBUTION MODEL BY: • USING NUMERICAL INTEGRATIONS • CALIBRATING THE FREE PARAMETERS USING THE OBSERVATIONAL DATA Our approach consists of 5 steps.
Step 1: Find “Primary” NEO Source Regions JFC MC 3:1 MC OB Nu6 Each source produces NEOs with a distinctive orbital distribution
Step 1 (continued): Determine the orbital distribution of NEOs coming from each Source Nu6 PRINCIPLE: The distribution of the residence times is equal to the steady-state orbital distribution of the NEOs coming from the considered source.
Step 2: Combine NEO Sources 3:1 Outer MB JFC IMC
Step 3: Create Model NEO Distribution We cannot compare our NEO model with data until we account for observational biases!
Step 4: Create Biased NEO Distribution • Combine NEO model with the probability than an object with given (a,e,i,H) with be discovered by Spacewatch.
Step 5: Compare Biased Model with NEO Data (5) (4) (3) Continue Until “Best-Fit” Found (2) (1)
Comparison Between NEOs and Best-Fit Model Source contributions Model fit to 138 Spacewatch NEOs with H < 22
There are ~ 970 NEOs with H < 18 and a < 7.4 AU. ~50% of them have been found so far. 60% come from the inner main belt (a < 2.5 AU). Debiased Orbital and Size Distribution of NEOs Amor: 32%; Apollo: 62%; Aten:6%; IEO: 2%
A SPECTRAL DISTRIBUTION MODEL From the spectral distribution of the bodies in/close the 5 main NEO sources we compute the spectral distribution of NEOs as a function of their orbital distribution. We estimate that: 1) the C/S ratio for an H-limited sample of the NEO population is 0.25 +/- 0.02 2) The C/S ratio for a size-limited sample of the NEO population is 0.87+/- 0.05
Using our NEO albedo distribution model we predict 834 bodies with D>1km, against 963 with H<18
To obtain a mass distribution we assume, in agreement with recent determinations by flyby missions or satellite detections, that: • C-type NEOs have density 1.3 g/cm • S-type NEOs have density 2.7 g/cm 3 3 With this, we have all ingredients to estimate the frequency of NEO collisions with the Earth as a function of impact energy:
WE PREDICT 4X LESS IMPACTS THAN PREVIOUSLY ESTIMATED Difference is likely due to an estimated smaller number of NEOs, different orbital distribution, improved bulk densities etc. The « measured » formation rate of 4 km craters on the Moon is: 3.3+/-1.7x10 -14 km2/y; our NEO model predicts : 2.73x10⁻¹⁴km2/y
NEO DISCOVERY STRATEGIES How to achieve the Spageguard goal (90% of H<18 NEOs within 2008) and beyond (90% of H<20.5 NEOs)? • Characterization of existing major surveys (LINEAR) • How to achieve the Spaceguard goal with a LINEAR-esque • strategy • Space-based strategies
We have constructed a pseudoLINEAR simulator, that simulates the average sky coverage of LINEAR and its average limiting magnitude V=18.5 QUALITY TEST I: In 2 years LINEAR increased the detected population of the NEOs with H<18 from 273 to 449. Our pseudoLINEAR simulator takes 2.14 years
QUALITY TEST II: The orbital-magnitude distribution of the first 469 NEOs with H<18 discovered by our pseudoLINEAR simulator mimics very well that of the 469 objects discovered so far by LINEAR and other surveys
PROSPECTS FOR ACHIEVING THE SPACEGUARD GOAL WITH A GROUND BASED SURVEY LSST? Currenttime Current completeness LINEAR
SPACE BASED SURVEYS • A space-based survey that duplicates the strategy of ground-based surveys will never be competitive in term of cost. • A space-based survey must take advantage of the location of the instrument in space by either: • Observe at small solar elongation or, • Search for NEOs from a point closer to the Sun than the Earth
Discovery efficiency of satellites with V=18.5 on NEOs with H<18 (Ideal situation with daily full sky coverage, except 45deg close to the Sun)
WARNING: the fact that a space-based survey detects NEOs that are not visible from the ground, implies that one cannot count on ground-based recoveries for follow-up and orbital determination Ground-based ecliptic coordinates of NEOs at the time of their discovery form a space observatory inside Venus’ orbit A space-based survey must be able to do its own follow-up
CONCLUSIONS • We have a model of the (a,e,i,H) NEO distribution • We estimate 963 NEOs with H<18 and 855 with D>1km • Our model predicts 4x less collisions than Shoemaker’s • We predict one 1,000MT collision every 63 Kyear • These collisions are caused in average by H ~ 20.5 • The Spaceguard goal should be extended to H=20.5 NEOs
CONCLUSIONS • We have a model of the (a,e,i,H) NEO distribution • We estimate 963 NEOs with H<18 and 855 with D>1km • Our model predicts 4x less collisions than Shoemaker’s • We predict one 1,000MT collision every 63 Kyear • These collisions are caused in average by H ~ 20.5 • The Spaceguard goal should be extended to H=20.5 NEOs
CONCLUSIONS • We have a model of the (a,e,i,H) NEO distribution • We estimate 963 NEOs with H<18 and 855 with D>1km • Our model predicts 4x less collisions than Shoemaker’s • We predict one 1,000MT collision every 63 Kyear • These collisions are caused in average by H ~ 20.5 • The Spaceguard goal should be extended to H=20.5 NEOs
CONCLUSIONS • We have a model of the (a,e,i,H) NEO distribution • We estimate 963 NEOs with H<18 and 855 with D>1km • Our model predicts 4x less collisions than Shoemaker’s • We predict one 1,000MT collision every 63 Kyear • These collisions are caused in average by H ~ 20.5 • The Spaceguard goal should be extended to H=20.5 NEOs
CONCLUSIONS • We have a model of the (a,e,i,H) NEO distribution • We estimate 963 NEOs with H<18 and 855 with D>1km • Our model predicts 4x less collisions than Shoemaker’s • We predict one 1,000MT collision every 63 Kyear • These collisions are caused in average by H ~ 20.5 • The Spaceguard goal should be extended to H=20.5 NEOs
CONCLUSIONS • We have a model of the (a,e,i,H) NEO distribution • We estimate 963 NEOs with H<18 and 855 with D>1km • Our model predicts 4x less collisions than Shoemaker’s • We predict one 1,000MT collision every 63 Kyear • These collisions are caused in average by H ~ 20.5 • The Spaceguard goal should be extended to H=20.5 NEOs
CONCLUSIONS (2) • To achieve a satisfactory completeness on the H<20.5 NEO population, ground based surveys should be pushed to V=24 • Spaced-based surveys can be effective only if • They observe at small solar elongation • They observe from a point placed a smaller heliocentric distance than the Earth • Space-based surveysmust do their own follow-up work
CONCLUSIONS (2) • To achieve a satisfactory completeness on the H<20.5 NEO population, ground based surveys should be pushed to V=24 • Spaced-based surveys can be effective only if • They observe at small solar elongation • They observe from a point placed a smaller heliocentric distance than the Earth • Space-based surveysmust do their own follow-up work
CONCLUSIONS (2) • To achieve a satisfactory completeness on the H<20.5 NEO population, ground based surveys should be pushed to V=24 • Spaced-based surveys can be effective only if • They observe at small solar elongation • They observe from a point placed a smaller heliocentric distance than the Earth • Space-based surveysmust do their own follow-up work