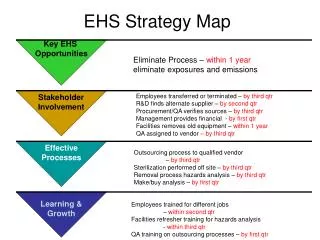
MAP Streamlining reporting strategy
MAP Streamlining reporting strategy. MAP reporting system-General. There is a need for coherence between MAP reporting commitments and global and regional conventions , programmes and EU directives There is a need for harmonization with EU reporting commitments

MAP Streamlining reporting strategy
E N D
Presentation Transcript
MAP reporting system-General • There is a need for coherence between MAP reporting commitments and global and regional conventions , programmes and EU directives • There is a need for harmonization with EU reporting commitments • There is a need for simplicity in the format adopted for the transmission
RATIONAL The Contracting Parties to Barcelona Convention at their 12th Meeting held in Monaco in November 2001 requested the MED POL Programme ”To review and develop a set of marine pollution indicators, in cooperation with Blue Plan, EEA, UNIDO-ICS and other competent bodies and organizations”.
RATIONAL • Indicators should be integrated in the MAP reporting strategy: • to supply information on environmental problems, in order to enable policy-makers to value their seriousness; • to support policy development and priority setting, by identifying key factors that cause pressure on the environment; • to monitor the effects of policy responses.
MEDPOL Policy demands With reference to the MED POL Programme, four major policy statements are to be considered • the Land Based Sources (LBS) Protocol and the Strategic Action Programme (SAP), • the Dumping Protocol. • Hazardous Waste Protocol.
The DPSIR Framework for Reporting on Environmental Issues Driving forces MCSD Responses MCSD Impacts?? Pressures MCSD MEDPOL States??
MEDPOL Strategy • To consider the Driving Forces and the Pressure indicators adopted by the MCSD • To consider the Pressure Responses and Driving force indicators generated by MAP reporting system • To develop ,at this stage, Impact and State indicators for marine pollution and
MEDPOL Proposal Three types of State – Impacts indicators are proposed in this framework: 1. Pressure indicators that could complement the existed MCSD indicators(MAP reporting system) • State indicators such as trends of levels, ecosystem stress; • Impacts indicators such as ecosystem stress and biological indicators (Biomarkers).
Biomarker Observation Enzymo/spectro Type Lysosomal stability µ State Lipofuschine µ State AChE * State BPH * State MTs * State GST * State CAT * State MDA * State/Impact Stress on stress * State/Impact Macrophage activity µ * Impact Micronuclei µ Impact EROD (F) * State Bile FACs (F)* * State Biomarkers core set
Indicator Taxonomy group Type Changes in population of key species CC Impact Occurrence of nuisance species (HABS) Plankton Impact Ecological quality index based on macrophytes Phytobentos State Number of macrobenthic species Zoobenthos State Benthix Zoobenthos State Changes in the distribution area of habitats types CC Impact Dominance Index Phytoplankton State Total phytoplankton biomass (mg m-3) Phytoplankton State Phytoplankton species composition - % composition of key groups (number and biomass) Phytoplankton State Seasonal succession of key phytoplankton species (cells l-1) Phytoplankton ? Annual maximum density (cells l-1) of each blooming phytoplankton species Described above as Occurrence of nuisance species (HABS) Phytoplankton impact Ecosystem core set
Indicator Media Type Total Mercury Biota State Total Cadmium Biota State Bacteriological count Bathing Water State Bacteriological count Shellfish Water State BOD,COD,Nutrients Heavy metals PAH+ HH+ Effluents Pressure Temperature,PH,Transparency, Salinity Ortophosphate,Total Phosphorus Silicate-Sio2 Disolved oxygen Total nitrogen,Nitrate,Ammonium Nitrite Chorophyll-a Sea water Sea water Sea water Sea water Sea water Phytoplancton State Total Mercury Total Cadmium Effluents,Water Air and Hot Spots Pressure Chemicals core set
The “ROAD MAP” At short term (2004-2006): • to develop methodology sheets for the set in line with existing sheets developed by related organizations; • to undertake a test procedure in a few Mediterranean countries; • to review the set according to the results of the test; • to propose the adoption of the set by Contracting Parties in 2005; • to perform Capacity building and intercalibration programmes • to undertake a Data gap analysis; • to coordinate the MEDPOL indicators activities with BP, MEDSTAT, SPA/RAC;EEA and others • to develop quality indices on the basis of the core set of MPI adopted; • to undertake periodical evaluation.
The “ROAD MAP” At medium term (2006-2010): • to review monitoring programmes to generate relevant meta data; • to confirm with national administration respective responsibilities on indicator production and data flows, in particular with EEA, MEDSTAT (and other organisations); • to build into the MED POL priority data flows system what is needed for those indicators and put these on a regular cycle e.g. annual • to develop methodologies and data flows for those indicators not yet developed; • to develop and produce regular thematic and sector indicator-based reports; • to develop modeling instrument for coastal risk assessment.
The “ROAD MAP” • The road will be implemented taking into consideration the achievements and on going activities of EEA in the field of indicators, • MEDPOL will review its monitoring and assessment programmes on the basis of the results of the short term activities • The strategy and “Road Map” is on the Agenda of the national MEDPOL coordinators meeting May 2003 and CPs meeting November 2003 for adoption and approval
Countries submitting monitoring data to MAP within MED POL Phase III (1996-2005) • Albania (ISO) • Croatia (ISO) • Cyprus (ISO) • Greece (ISO) • Israel • Slovenia (ISO) • Tunisia • Turkey (ISO) • Data coverage for the period 1999-2002 • Most of the data of this period has been loaded to the new Database of MED POL in 2003
Type of monitoring data • Sites/ Monitoring Activities • Hot spots, coastal & reference areas / state, trends and biological effects monitoring, • compliance monitoring of health-related conditions • Rivers, direct discharges / monitoring of loads and • compliance monitoring of effluents • Major parameter groups / matrices • Trace metals / Biota, sediment • Organic contaminants / Biota, sediment • Nutrients / Sea water, river and effluents
Timetable of data dataflow to MED POL Data submission Annually submitted being in December-February Countries are asked to complete any missing information. Final submission by the end of May. Data loading March for 1st submission and June for the last submission. Validation Not automated yet * The whole procedure can turn to routine in 2004.
How the countries report to MED POL • They are asked to report the raw data in standard formats in Excel. • MED POL formats are available for the following group of activities • Biota-trace metals • Biota-organics • Sediment-trace metals • Sediment-organics • Bio-monitoring • Sea water • Loads-effluents & rivers • Loads-Atmospheric dry & wet deposition • Certified Reference Material analysis
MEDPOL Phase III data reporting formats for (State and) Trend Monitoring Table 1 BIOTA (TRACE METALS) DATA REPORTING TABLE for MEDPOL Phase III The formats, their descriptions and the codes are downloadable from MED POL web pages
Station Samples Analyses Data (measuredparameters) MED POL Database (MEDPOL.mdb) Created by using MS Access 2000 and configured by using hierarchical structure Conceptual Design of the MED POL Database, UNEP(DEC)/MED WG.202/2
Data management and administration module of the database consists of MS Access forms, queries, reports and VBA modules.
Map image contains: • Med. coastline and isobaths ( GEBCO Digital Atlas) • Country borders • Contours of main rivers • Markers of station positions St. map form St. map form w/ popup menu St. map form after zooming
Export data tool Select Parameters tool
Internet version of the Database Information accessible through static HTML pages
Database inventory accessible through dynamic Active Server Pages Search criteria can be established both for stations and samples
Thank you For your attention