Download

1 / 13
140 likes | 366 Views
Academic Disciplines and Level of Academic Challenge. Gary R. Pike University of Missouri–Columbia. The Opportunity. The MU benchmark score for Level of Academic Challenge was significantly lower than the benchmark score for our peer institutions (AAU Public Research Universities).

E N D
Academic Disciplines and Level of Academic Challenge Gary R. Pike University of Missouri–Columbia
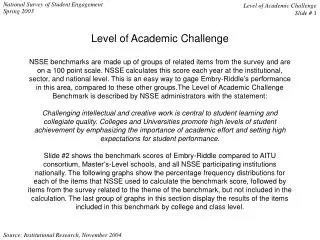
The Opportunity • The MU benchmark score for Level of Academic Challenge was significantly lower than the benchmark score for our peer institutions (AAU Public Research Universities). • This was particularly true for our seniors.
Step 1: Item Analysis • Items with substantial differences: • Spending significant amounts of time studying (0.10) • Number of written papers of 20 pages or more (0.19) • Coursework emphasis: Analysis (0.08) • Coursework emphasis: Synthesis (0.12) • Coursework emphasis: Evaluation (0.17)
Step 2: Identifying Disciplinary Differences • Rationale • There is a large body of literature indicating that different types of academic challenges are posed by different academic disciplines. • By identifying disciplinary differences it may be possible to target specific improvement actions.
The Approach • Ratcliff, Jones, and their colleagues developed a method of linking specific patterns of course taking with gains in general education. • It should be possible to use a variation of this approach to identify disciplinary differences in Level of Academic Challenge items.
The Method • Calculate mean scores on each item for each discipline using AAU data and self-reported major. • Majors are variables • Items are observations • Cluster together majors with similar response profiles. • Use discriminant analysis to identify how the clusters differ.
The Method (Continued) • Calculate parallel cluster means for each item using only the MU data. • Compare AAU and MU means • Are the response profiles similar? • Are there substantive differences in means between the AAU and MU clusters?
Results: Cluster Analysis • Cluster 1: Science, Math, Engineering • Biological Sciences, Computer & Information Sciences, Engineering, Health-Related Fields, Mathematics, Physical Sciences, & Visual Arts. • Cluster 2: ? • Agriculture, Business, Communication, General Studies, Public Administration, & Social Sciences. • Cluster 3: ? • Education, Foreign Languages, Humanities, Interdisciplinary, & Parks and Recreation.
Results:Discriminant Analysis • Function 1 (Cluster 1): • High on studying, class preparation, and application. • Low on number of texts, writing, and evaluation. • Function 2 (Cluster 3 vs. Cluster 2): • (3) High on class preparation and synthesis. • (3) Low on analysis and application.
Results for MU Seniors • Cluster 1 (MU lower): • Time spent studying (0.18)* • Preparing for class (0.11)* • Papers of 20 or more pages (0.23) • Analysis (0.12) • Synthesis (0.23) • Evaluation (0.20) • Cluster 1 (MU higher): • Assigned texts (0.10)
Results for MU Seniors • Cluster 2 (MU lower): • Papers of 20 or more pages (0.13)* • Evaluation (0.11) • Cluster 2 (MU higher): • Class preparation (0.15)* • Application (0.08)*
Results for MU Seniors • Cluster 3 (MU lower): • Time spent studying (0.16) • Class preparation (0.07)* • Assigned texts (0.28) • Papers of 20 or more pages (0.29) • Papers of less than 20 pages (0.16) • Analysis (0.27)* • Synthesis (0.19)* • Evaluation (0.28) • Application (0.14)* • Cluster 3 (MU higher) • Worked harder than you expected (0.16)
Conclusions • Disciplines do make a difference and the results for MU were generally consistent with the results for other AAU institutions. • MU’s cluster 2 students not different from cluster 2 students from other AAU institutions. • MU’s cluster 1 students somewhat lower than cluster 1 students from other AAU institutions. • MU’s cluster 3 students were substantially lower than cluster 3 students from other AAU institutions.