Download
1 / 48
480 likes | 592 Views
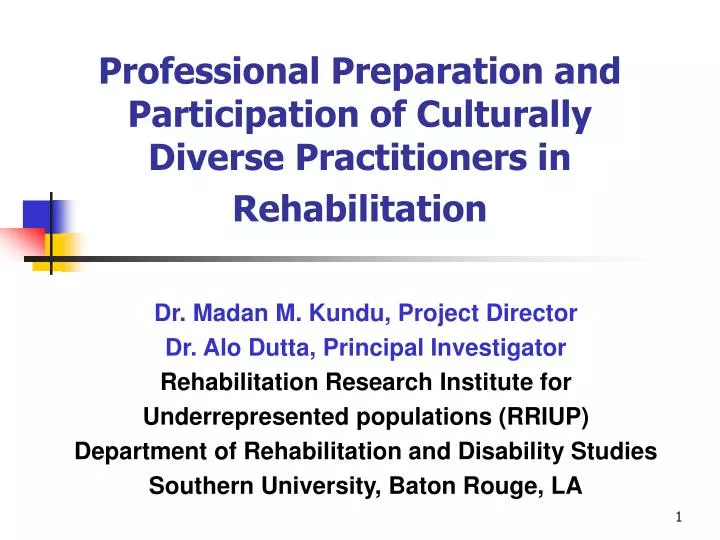
Professional Preparation and Participation of Culturally Diverse Practitioners in Rehabilitation. Dr. Madan M. Kundu, Project Director Dr. Alo Dutta, Principal Investigator Rehabilitation Research Institute for Underrepresented populations (RRIUP)

E N D
Professional Preparation and Participation of Culturally Diverse Practitioners in Rehabilitation Dr. Madan M. Kundu, Project Director Dr. Alo Dutta, Principal Investigator Rehabilitation Research Institute for Underrepresented populations (RRIUP) Department of Rehabilitation and Disability Studies Southern University, Baton Rouge, LA
Learning Objectives • The participants will: • comprehend the changing demography and prevalence of disabilities in the U.S. • learn about the employment and unemployment rates of persons with disabilities from diverse background. • understand the composition of practitioners in state-federal VR, their academic preparation, and its probable effects on the quality of employment outcome for persons with disabilities.
PREVALENCE OF DISABILITIES IN THE U.S. • 1 in 5 community dwelling adults in the U.S. report some type of disability • Persons with disabilities are more likely to have: • Self-reported fair to poor health • Serious psychological distress • More co-morbid health conditions • Lower income/Fewer resources
Prevalence of Disabilities Among Adultsin the U.S.: 2005 Age-adjusted percent Total American Indian Hispanic White Male Female 18-44 45-64 65-74 75+ Asian Black I= 95% confidence interval. NOTE: Data are for civilian non-institutionalized adults 18 and over, and are age adjusted to the 2000 standard population. Age-specific estimates are not age-adjusted. American Indians includes Alaskan Native. Asian includes Pacific Islander. The black and white categories exclude persons of Hispanic origin. Persons of Hispanic origin may be any race. Respondents were asked to select one or more races. Data for the single race categories are for persons who reported only one racial group. SOURCE: National Health Interview Survey (NHIS), CDC, NCHS.
Employment • In 2006: • Total employment (146.1 million) • The employment-population ratio=63% • The labor force participation rate=66.1% • Caucasians (66.5%) • African Americans (64.4%) • Asians (67.1%) • Hispanics (68.7%) • Women held: • 56.3% of all professional and related jobs • 42.5% of management-related, business and finance positions Source: Bureau of Labor Statistics (2006)
Employment • In 2006: • 1.4 million were marginally attached to the labor force • They wanted and were available to work and had looked for a job sometime during the prior 12 months. • They were not counted as unemployed because they had not searched for work in the 4 weeks preceding the survey. • Among the marginally attached, 367,000 discouraged workers • Discouraged workers were not currently looking for work specifically because they believed no jobs were available for them. • The remaining 1.0 million persons marginally attached to the labor force in July for reasons such as school attendance and family responsibilities Source: Bureau of Labor Statistics (2006)
Unemployment • In 2006: • 7.1 million unemployed in the U.S. • Unemployment rate – 4.7% • Adult men (4.2%) and adult women (4.1%) • Teenagers (15.2%) • Caucasian men (4.2%) • African Americans (8%) • Hispanic Americans (5.9%) • Asian Americans (3%) • 1.3 million unemployed 27 weeks+ (18.4% percent of total unemployment – up since 2005) • 50.9% of the total unemployed population was comprised on those unemployed due to job loss. Source: Bureau of Labor Statistics (2006)
Unemployment • In 2006: • Unemployment rate of minorities reduced to 5.4% from almost 9.4% in 2005 • Number of minorities in professional and managerial positions has steadily increased Source: Bureau of Labor Statistics (2006)
Employment Parity Among Adults with Disabilities Percent Increase desired 90 1997 2005 2010 Parity Target: 80 60 30 0 Hispanic Black White Male Female Total Race/ethnicity Gender I= 95% confidence interval. NOTE: Data are for civilian non-institutionalized persons aged 18–64 years with disabilities who are employed. The black and white categories exclude persons of Hispanic origin. Persons of Hispanic origin may be any race. Prior to 1999, respondents were asked to select one race category; selection of more than one race was not an option. For 1999 and later years, respondents were asked to select one or more races. Data for the single race categories are for persons who reported only one racial group. SOURCE: National Health Interview Survey (NHIS), CDC, NCHS. Obj. 6-8
Employment: The employment rate of working age people with disabilities decreased from 37.9% in 2003 to 37.5% in 2004.- 18 million people with disabilities are currently in the U.S. work force.Full-Time/Full-Year Employment: The percentage of working age people with disabilities working full-time/ full-year decreased* from 23% in 2003 to 22.4% in 2004.Annual Labor Earnings: The median annual labor earnings of working age people with disabilities working full-time/full-year was unchanged from $30000 in 2003 to $30000 in 2004, in the US.Household Annual Income: The median household annual income of working age people with disabilities increased from $34200 in 2003 to $34300 in 2004.Poverty: The poverty rate of working age people with disabilities increased* from 23.3% in 2003 to 24.1% in 2004. Source: Cornell RRTC, 2005
Diverse Populations in Labor Force • Work evenings, nights, and weekends • Part-time schedule • Higher unemployment rate • Low paid, dead end jobs • Un- or under-insured Source: Hamermesh (1996)
Average Weekly Hours: Workers With vs. Workers Without Disabilities (1981-1999) Disability Without Disability • 1981: 35 38 • 1983: 32 37.5 • 1985: 35.5 38.2 • 1987: 35 38.5 • 1989: 34.2 38.5 • 1991: 34.3 38.7 • 1993: 33.9 38.9 • 1995: 33.7 38.9 • 1997: 32.9 39 • 1999: 32.6 39 Source: U.S. Bureau of Census (2000)
Economic Well-Being of Working Age Population with Disabilities • Change (1989-2000) in mean household income: • People without disabilities: • Men: +9.4% • Women: +12.6% • Employment rate in pro-cyclical • People with disabilities: • Men: -2.9% • Women: +5.6% • Employment rate fell during recession and recovery • Mean income from SSI and SSDI • Men: +33.8% • Women: +13.8% Source: Stapleton and Burhauser (2003)
Possible Reasons for Low Participation • More women than men with disabilities • Jobs may have changes in ways that make it more difficult for this population to compete • Decline in job security → job change+reduced attachment to one employer • Rising health care cost → employers less willing → reduced attractiveness for this population • Increase in the number of working age population with significant disabilities • Able to work at all vs. total population with disabilities Source: Stapleton and Burkhauser (2003)
Many jobs are destroyed, but many jobs also are created than is apparent from the changes in total employment.Since August 2003, more than 8.3 million jobs have been created. Source: Klien, Schuh and Triest (2003); Bureau of Labor Statistics (2006)
Since as many as 25% - 40% of the workforce lack the basic skills to understand written or verbal communications, it is little wonderthey have problems adapting tochanges in the workplace. Source: Hollenbeck (1993)
VR SERVICE DELIVERY SYSTEM • 79 state agencies (general and blind) • A 2003 CSAVR Survey of 32 agencies • 50% said CRC eligibility a priority • 56% said extension of D-4 deadline necessary • Planned funds for VR counselor training: $0 - $236,000 • 67 American Indian VR Programs • A 2003 CANAR Survey of 32 programs • HS = 30%; AA = 21% Bachelor's = 26%; Master’s = 20% • 7.2% has CRC • The nearest school is on average 58 miles away • 74% has staff development program for employees
Ethnicity by Position: State Office Staff2002 CA AA HA Asian P. Is NA 350 291 300 250 200 156 150 100 51 29 29 21 17 50 6 5 4 3 2 1 1 1 1 1 0 Director Administrator Supervisor
CA 3556 AA 3501 HA Asian 3001 P. Is NA 2501 Other 2001 1501 733 1001 587 567 501 176 146 121 97 39 35 34 30 21 8 8 6 5 3 3 1 1 1 Administrator Supervisor Rehabilitation Counselor ETHNICITY BY POSITION: District Offices Staff2002
Educational Attainment: Training Facilities Staff2002 Rehabilitation 136 25.0% Allied Health 179 32.8% Other 230 42.2%
Salary of Personnel: 1997 & About 43% of state-federal personnel earn below median & State Office Staff (37% earn below median) & Directors-36% earn below $60,000 & Administrators-48% earn below $50,000 & Supervisors-28% earn below $35,000 & District Offices Staff (45% earn below median) & Administrators-48% earn below $45,000 & Supervisors-42% earn below $40,000 & Rehab. Couns.-46% earn below $30,000 & Training Facilities Staff (33% earn below median) & Supervisors-40% earn below $35,000 & Job Pl. Sp.-28% earn below $25,000 & Training Personnel-33% earn below $25,000
Salary of Personnel: 2002 & About 33% of state-federal personnel earn below median & State Office Staff (42% earn below median) & Director-34% earn below $80,000 & Administrators-46% earn below $55,000 & Supervisors-40% earn below $55,000 & District Offices Staff (48%earn below median) & Administrators-43% earn below $55,000 & Supervisors-47% earn below $50,000 & Rehab. Coun.-38% earn below $35,000 & Training Facilities Staff (48% earn below median) & Supervisors-47% earn below $50,000 & Job Pl. Sp.-49% earn below $45,000 & Training Pers.-42% earn below $30,000
RECOMMENDATIONS • Pre- and in-service training to inculcate: • clinical and direct services provision skills, administrative skills, and organizational skills • knowledge in non-disability related areas such as human resource development • VR minimize/discontinue evaluation of counselors on the basis of Status 26 closures • Evaluation based on the overall quality of their performance: Weighted Case Closures • Offering of a productive career path with commensurate remuneration • Private agencies & VA pay at least $5,000-$15,000 more than state VR agencies
RECOMMENDATIONS (contd.) • State agencies need to increase salary, reduce caseload, and improve working conditions for rehabilitation counselors. • State agencies/CRPs offer paid internships • Establish national On-line JOB BANK and TALENT BANK
RECOMMENDATIONS (Cont’d) • RSA enhance funding of Long-Term Training programs in 2-year colleges that are most accessed by people with disabilities and minorities. • Utilize Rehabilitation Capacity Building initiatives to develop new and support existing rehabilitation counselor training programs in HBCUs, HSIs, NASIs, and APISIs. • Rehabilitation Counselor Education Programs infuse the concept of multiculturalism across curriculum. • Replication of the study in Section 121 American Indian VR Programs. • Longitudinal research on the effects of counselor-client racial identity on VR outcome.
Collective Vision for the Future • A number of functions performed by rehabilitation counselors may soon be consolidated under one broad-based organizational consultant. • Rehabilitation counselors should be prepared to horizontally expand their role in the world of work. • As the arena of disability management evolves, these competencies will enable professionals to secure and maintain involvement as the primary facilitators of services for people with disabilities. • CORE and CRCC should take an active role in re-defining and expanding the professional/educational standards in rehabilitation counseling.
“Reasonable People Adapt to the world around them; unreasonable people make the world adapt to them. Therefore, progress is made by unreasonable people.” Samuel Butler Educator