Download
1 / 1
10 likes | 95 Views
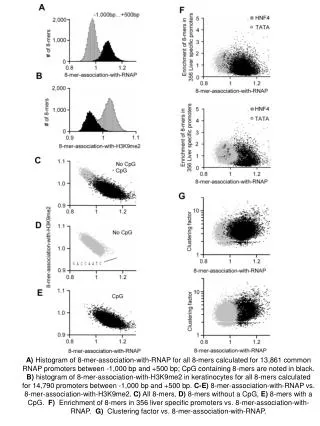
Histograms show the distribution of 8-mers in common RNAP and H3K9me2 promoters. CpG-containing 8-mers highlighted in black. Explore associations and enrichments in liver-specific promoters.

E N D
A) Histogram of8-mer-association-with-RNAP for all 8-mers calculated for 13,861 common RNAP promoters between -1,000 bp and +500 bp; CpG containing 8-mers are noted in black. B) histogram of8-mer-association-with-H3K9me2 in keratinocytes for all 8-mers calculated for 14,790 promoters between -1,000 bp and +500 bp. C-E) 8-mer-association-with-RNAP vs. 8-mer-association-with-H3K9me2. C) All 8-mers, D) 8-mers without a CpG, E) 8-mers with a CpG. F) Enrichment of 8-mers in 356 liver specific promoters vs. 8-mer-association-with-RNAP. G) Clustering factor vs. 8-mer-association-with-RNAP.