Download
1 / 20
200 likes | 316 Views
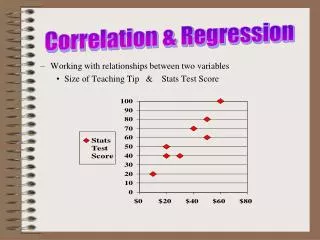
Correlation & Regression. Working with relationships between two variables Size of Teaching Tip & Stats Test Score. Overview. Paired Data is there a relationship if so, what is the equation use the equation for prediction. Positive Linear Correlation. y. y. y. x.

E N D
Correlation & Regression • Working with relationships between two variables • Size of Teaching Tip & Stats Test Score
Overview Paired Data • is there a relationship • if so, what is the equation • use the equation for prediction
Positive Linear Correlation y y y x x x (a) Positive (b) Strong positive (c) Perfect positive Figure 9-2 Scatter Plots
Negative Linear Correlation y y y x x x (d) Negative (e) Strong negative (f) Perfect negative Figure 9-2 Scatter Plots
Scatterplot! • No Correlation • Random or circular assortment of dots • Positive Correlation • ellipse leaning to right • GPA and SAT • Smoking and Lung Damage • Negative Correlation • ellipse learning to left • Depression & Self-esteem • Studying & test errors
Definition • Linear Correlation Coefficient r measures strength of the linear relationship between paired x- and y-quantitative values in a sample
Definition • Linear Correlation Coefficient r sometimes referred to as the Pearson product moment correlation coefficient
Pearson’s Correlation Coefficient • “r” indicates… • strength of relationship (strong, weak, or none) • direction of relationship • positive (direct) – variables move in same direction • negative (inverse) – variables move in opposite directions • r ranges in value from –1.0 to +1.0 -1.0 0.0 +1.0 Strong Negative No Rel. Strong Positive • Go to website! • playing with scatterplots
Notation for the Linear Correlation Coefficient n number of pairs of data presented. denotes the addition of the items indicated. x denotes the sum of all x values. x2 indicates that each x score should be squared and then those squares added. (x)2 indicates that the xscores should be added and the total then squared. xy indicates that each x score should be first multiplied by its corresponding y score. After obtaining all such products, find their sum. r represents linear correlation coefficient for a sample represents linear correlation coefficient for a population
Definition Linear Correlation Coefficient r nxy - (x)(y) r = n(x2) - (x)2 n(y2) - (y)2 Formula 9-1
Definition Linear Correlation Coefficient r nxy - (x)(y) r = n(x2) - (x)2 n(y2) - (y)2 Formula 9-1 Calculators can compute r (rho) is the linear correlation coefficient for all paired data in the population.
The IB Pearson Product Correlation Equation Sxy is the covariance and Sx and Sy are the standard deviations of x and y respectively.
r value continued • On you GDC you will also be given r2, the coefficient of determination. This is an indication of how the variation in one set of data, y, can be explained by the variation in the other set of data, x. • For example, if r2 = .866, this means that 86.6% of the variation in set y is caused by the variation in set x. For this value of r2 , r = .930 which indicates a strong positive linear relationship.
Example • The data below are for the Dutch football first division and they show the position of the team and the number of goals scored. Given Sxy = -74.4, calculate the correlation coefficient, r, and comment on the value.
Solution • The covariance has been given so you use the formula to find r. • 1st determine Sx= 5.19 • 2nd determine Sy= 14.8 • 3rd determine r • 4th check with GDC, r = -.968 • This has a very strong, negative linear relationship
When you are NOT given covariance • USE THE r PROVIDED BY THE GDC
Determining the linear regression formula • The formula for the regression line of y on x is • Where and are the means of x and y, and Sxis the standard deviation of x and Sxyis the covariance. • In exam questions you will be given the value of Sxy. If you are, you must show your work.
Example • Dave thought that there was a strong correlation between a child’s IQ and SAT score. The IQ scores of some children were • 89 92 96 99 100 102 111 113 128 135 • Calculate • The mean IQ • The standard deviation of the IQ • Given that their mean SAT score was 896 with a standard deviation of 174 and that Sxy = 2740, find the regression line of yon x.
Solution • From the GDC, the mean IQ = 104 • From the GDC, the standard deviation = 16 • Calculate the regression line
When you are NOT given covariance • USE THE equationPROVIDED BY THE GDC