Download
1 / 56
560 likes | 724 Views
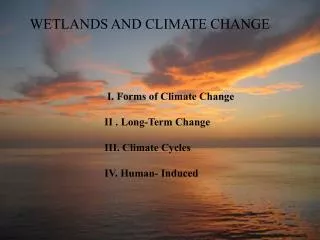
WETLANDS AND CLIMATE CHANGE. I. Forms of Climate Change II . Long-Term Change III. Climate Cycles IV. Human- Induced. I . Long term - Global Warming Sea Level Rise/Subsidence CO 2 Rise Ocean Acidification Temperature Rise II. Climate Cycles Regime Shifts El Niño /NAO

E N D
WETLANDS AND CLIMATE CHANGE I. Forms of Climate Change II . Long-Term Change III. Climate Cycles IV. Human- Induced
I . Long term - Global Warming • Sea Level Rise/Subsidence • CO2 Rise • Ocean Acidification • Temperature Rise • II. Climate Cycles • Regime Shifts • El Niño /NAO • Precipitation • Drought • III. Human- Induced • Freshwater inputs • Sedimentation • Circulation • Hypoxia • Urban development - wastewater
AT THE ROOT OF MUCH CLIMATE CHANGE: Rising CO2 Warming Acidification Sea Level Rise Changing circulation
Causes of Sea Level Rise • Warming Ocean - Expansion of seawater • Melting Ice
IPCC Report/Andrew Weaver • 3000 y ago to 1900 : Rise of 0.1-0.2 mm/y • Today: Global Average of 3mm/y • End of Century: 30 to 45 cm increase • Does not account for Greenland melting, which could add 19-58 cm. • Complete melting of Greenland (1700 years) would occur with a 2.5-3oC rise in temperature • Greenland melting will lead to a 7 m rise in sea level. • (Covering much of W. Europe/ Manhattan)
Sea-Level Rise in Wetlands • Measuring Elevation • SET Table • Feldspar Marker • Pb-210, Cs 137 • Tidal Gauges Rates of accretion compared with rates of sea-level rise. But: measurements are short-term and rate of rise is unknown.
SEA-LEVEL RISE Past measurements: 0.86 mm/y Australia Mangrove encroachment 2.6-3.9 mm/y Mid Atlantic Salt Marsh loss (10-20%) Loss of habitat for 9 migratory shore birds that use the marsh 2.5 mm/y New England 1.2 cm/y ? (subsidence) Chesapeake Bay 0.48 mm/y (SL rise - 142 y) North Carolina 0.6 mm/y (rise - 200 y) Wadden Sea Netherlands Coastal erosion is 100x the rate of sea level rise. Subsidence San Francisco Bay - 3-5 mm/y, Coyote creek 10-25 mm/y Wadden Sea - 1-6 mm/y due to compaction, oil and gas extraction (Wadden Sea, LA)
Accretion must exceed sea level rise for wetlands to persist(deposition + plant biomass) Accretion Rates: 0-11 m/y (Wadden Sea) Highest in summer, young marshes Short-term rates are higher than long-term rates due to compaction van Wijnen and Bakker - At current rate of sea level rise it will be 500 y until low marshes of the Wadden Sea deteriorate. (may no longer be true)
Accretion rates are higher on the Gulf than Atlantic coasts Accretion rates on the open coast are higher in the absence of hurricanes but rates inland are lower. Net accumulation rates indicate substantial loss of marsh in Louisiana
Turner et al. Science 2006 Wetland sedimentation from Hurricanes Katrina and Rita 130 * 106 mt sediment accumulated in coastal wetlands of Gulf Of Mexico when Katrina and Rita crossed shore in 2005 278 * 106 mt accumulated in shallow subtidal waters = 12 % of Mississippi load/y = 5.4% of pre levee flood deposits/y =208 times amount deposited in river diversions Authors conclude that hurricanes can provide the inorg. Sediments needed for a healthy wetland.
Sea-Level Effects on Wetlands • Landward progression, rate determined by rate of SL rise • Rates of accretion decline over time • due to to rise in elevation which reduces inundation time • Accretion = deposition-erosion • Erosion at seaward front • Increased peat saturation, salinity, sulfide conc., decreased O2 • Altered zonation patterns • Warren and Niering (1993) - Juncus to forbs (Triglochin) • S. patens to S. alterniflora & Distichlis spicata • Low marsh at greatest risk (greatest increase in inundation) • Where seawalls or development form landward boundary, • marshes will become narrower • Given that marshes move, should we be trying to maintain status quo?
Sea Level and Mangroves Mangroves are likely to be favored over marsh grass where they co-occur under conditions of rising sea level and warming waters. Expecially if grasses are stressed.
Alternatives for protecting wetlands from rising sea level(USA EPA) Increase wetlands’ ability to keep pace with sea level (supply sediment) - e.g., supply sediment 2) Protect coastal barriers (barrier islands, spits) 3) Create no development buffers 4) Construct tide protection systems (dikes, pumps, gates)
SAV Response to Climate Change - Jacoby USGS • A rise in sea level along the Gulf Coast will lead to changes in hydrology, salinity, and other abiotic factors that impact SAV. • While projected climate changes may be under debate, changes in regional hydrology, salinity and nutrient regimes are certain • While native SAV plays an important role in estuarine communities, invasive, exotic SAV species can play a harmful role ecologically, by out-competing and • replacing native species. Several of these alien SAV species can, under certain conditions,become so prolific they create water quality problems and hinder navigation. • Changes in SAV communities thus have profound implications for local and regional biota, shoreline geomorphology, biogeochemical cycles, and human activities. • The productivity, distribution, and extent of SAV are extremely susceptible to the direct and indirect effects of global change processes.
Excerpts of "Climate Change and its Impacts: A Global Perspective" • Some recent results from the UK research programme; Department of the Environment • Transport and the Regions, The Met Office, December 1997 & November 1998. • Without specific adaptation, sea-level rise will significantly increase the • flood risk to coastal populations (e.g., via loss of wetlands) • Coastal wetlands are expected to decline due to sea-level rise, with the • largest losses around the Mediterranean and Baltic and on the Atlantic • coast of Central and North America. • There is a commitment to sea-level rise which means that some impacts • will continue to occur for centuries even if climate change is halted.
Increased CO2 Concentration • predicted: 0.5% rise per year, increase to 500 ppm • doubling of pre industrial levels by 2100 • Wetland plant response studied by: • -growth at natural CO2 springs • -artificial enhancement (tundra, brackish marsh, salt marsh) 3.6 percent of Earth’s land area that is now wetlands may stockpile between 10 and 30 percent of all the carbon stored on planet surface loss of wetlands may release this as CO2 back into the atmosphere
C3 vs C4 plants • Plants are only 80% efficient at removing CO2 for photosynthesis, and efficiency decreases at higher temperatures • C4 plants have a mechanism to increase concentration of CO2 at Rubisco site, increasing efficiency of CO2 uptake • C4 - involves 4 carbon intermediate in the outer cells, but requires ATP… most effective in warmer climate where ratios of O2 and CO2 change.
Photosynthesis is stimulated by elevated CO2 in C3 plants because • the enzyme that helps fix CO2 into sugars is less inhibited by • oxygen in the leaf at high CO2 concentrations. • Carbon storage in C3 plants may also be increased by a decrease • in the respiration rate of plants--the rate at which stored carbon • compounds are converted into CO2, water and energy. • Consistent increase in photosynthesis and a decrease in respiration • was observed in a C3 brackish marsh dominated by • Scirpus olneyi exposed to 700 ppm CO2(twice ambient concentrations) (Arp and Drake 1991; Drake 1992; Arp et al. 1993, Drake et al. 1996a). • There is no direct effect of CO2 on C-4 plants because the • carbon fixing enzyme is not oxygen inhibited
Increased carbon assimilation in C-3 dominated marsh but not • in C-4 marsh. But effects change over time. • Tundra experiments show CO2 stimulation of C fixation is short lived (1 year), due to nutrient limitation
CO2 effects on plant water use • The size of the stomatal opening is controlled by the concentration • of CO2 and water vapor inside the leaf, • Elevated concentrations of atmospheric CO2 tend to decrease the • size of the stomatal opening, which results in a decrease in transpiration. • Elevated CO2 has significantly decreased water loss in both C3 and • C4 communities in MD marshes by as much as 30%. • This decrease in water loss paired with the increase in carbon uptake, • has translated to an increase in plant water use efficiency, in some • years an increase of over 100% (Drake 1992). • Elevated CO2 may help some wetlands stay wetter
What are effects of increase assimilation efficiency and water use efficiency? • litter decomposition • plant-microbe interactions, • plant-animal interactions • plant-plant interactions • C3 plants at elevated CO2 levels: • Increased resistance to fungal damage • Greater N2 fixation by root bacteria • Increased methane formation, nematodes, foraminifera • Shift in C3/C4 composition • Anne Marsh, National Wetlands Newsletter, Vol. 21, No. 3.(1999) • Dacey et al. 1994; Drake and Ruiz, unpublished data • Arp et al. 1993
CO2 Effect on Soil Respiration(Ball and Drake 1998) Hypothesis - Increased resource use efficiency may stimulate soil microbial processes, increasing nutrient turnover and leading to increased soil respiration and soil carbon accumulation. Observations: Soil respiration rates in chambers with elevated CO2 were always higher than in chambers with ambient CO2. Larger effect with C3 plants present than C4 plants (related to root biomass and root exudation response to CO2). BUT: Uncovered soil respiration rates always higher than chamber rates. Could be related to limited insect access in chambers. Tropical plants - respiration rate not stimulated (nutrient limitation?)
CO2 Effect on N2 Fixation(Dakora and Drake 2000) Examined in salt marsh via: nitrogenase activity (acetylene reduction method) 15N incorporation via 15N2 gas • Taxon Nitrogenase activity 15N incorporation • Scirpus olneyi 35% rise 73% rise • Spartina patens 13% rise 23 % rise • Results comparable to stimulation of photosynthesis by CO2. • Indicates that increased C fixation of plants will be passed onto • endophytic and below ground microbes
Response to Elevated CO2 • Mangroves: • Enhanced water content • May not increase canopy • photosynthesis growth and litterfall • Increased rate of vertical accretion • Species responses will vary • Seagrasses: • Excess epiphyte growth • Increased ratio below: above ground biomass • Possible increase in C:N ratio - • changing quality as food
Corals Calcareous plankton http://www.biol.tsukuba.ac.jp/~inouye Photo: Missouri Botanical Gardens Ocean acidification • CO2 dissolves in seawater to make carbonic acid • Carbonic acid is corrosive to the shells and skeletons of many marine organisms
Atmospheric CO2 = 370 ppm Atmospheric CO2 = 680 ppm Atmospheric CO2 = 780 ppm Future ocean chemistry Most corals require over 3.5 saturation Atmospheric CO2 = 785 ppm Atmospheric CO2 = 280 ppm NOAA (Feely et al., in press)
What will happen to wetlands as oceans acidify? • Wetland calcifiers include: • Bivalves (mussels, clams, oysters, scallops) • Foraminifera • Fish (otoliths) • Processes that could be affected by pH • Decomposition, Photosynthesis, N cycling
Methane as a greenhouse gas Sources of methane: (1) anaerobic decay in wetlands (2) anaerobic fermentation in cattle rumens (3) natural gas leakage Current levels: 1.7 ppm, rising at 1-2% per year Warming may accelerate methane release CO2 additions will stimulate methane release
Sedimentation • Causes: • deforestation • logging • grazing • road building • development: • plant removal, paving • FENCES
New Zealand - can receive 10 y delivery in 1 day. • Experimental application of terrigenous slurry • (Lohrer et al.) • Number of indiv. declines with 7 mm deposit • Number of species declines with 7 mm deposit • Massive change in macrobenthos community structure
Temperature Rise • Global Warming: • More warming over land than ocean (land warms faster) • More warming at high than low latitudes (albedo) • More warming in N. than S. hemisphere (more land in N) • More warming in winter than spring (albedo - ice) • Global trends toward hotter, dryer climate
Warming and Oxygen • Warmer, saltier water holds less oxygen (seawater incursion) • Warmer water increases oxygen demand by organisms • Biota near thermal limits may not have circulatory capacity to supply oxygen • Changes in organisms distributions, local extinctions are likely. • DO water quality standard for estuaries: 5 mg/l • Small temp. increase drops estuaries below the standard (Texas) • Levings et al. 120 exotic species in GA - small change in temp • can lead to significant changes in abundance in species whose • N and S range are limited by water temperature.
Mangroves: Temperature Rise • Expansion into higher latitudes • Increase in photosynthesis, respiration, litterfall • Increased rates of microbial decomposition • Increase in plant and animal biodiversity • Change in densities, composition, growth and reproduction • Reduced rate of vertical accretion.
Wetlands can modify climate • Wetlands cover 6% of land surface but contain 35% of the • terrestrial biosphere carbon pool. (770Gt) Of this 540 Gt is peat. • Wetlands are carbon reservoirs. These will supply C to the • atmosphere if water levels are lowered or land use increases • oxidation of soils. Significant CO2 can be released. • Wetlands release C as CO2, dissolved C and methane • 3-4oC warming would eliminate 85% of wetlands in So. Europe • 1 m rise in sea level would eliminate 50% of coastal wetlands. • Major threats to biodiversity
Marshall Pielke, Steyaert Nature 426: 29 ( 2003) • Land use is one way humans affect climate • Extensive drainage of So. FL wetlands to convert land into • winter vegetable, sugar cane and citrus crops • Severe freeze on Jan 19 1997 led to 300 million loss in vegetable/ • sugar cane agriculture, and displaced 100,000 migrant farm workers • Computer simulation of climate under pre 1900 and 1993 • land-use conditions demonstrates different minimum temperatures as • a function of land use. • Draining wetlands leads to more frequent, more intense freezes • in south Florida
land use Min Temp Marshall et al. 2003 pre 1900 1993
Drought • Longer periods without precipitation • Higher maximum temperature • Drier conditions • Increased temperature and precipitation variability Mississippi R. drought 1998-2001 - low river input, low water levels led to “Brown Marsh Event” in FL, TX, LA wetlands >100,000 acres of marsh affected in patches 300 m2 to 5 km 2. 50-100% plant mortality, pH drop from 7 to 4 Elevated Na, K, oxidized iron S. alterniflora and S. patens affected. (C-4 plants) Avicennia germinans and Juncus roemerianus unaffected (C-3) Experiments show moisture and iron had big effects on S.alterniflora.
Brown Marsh Event The Saltwater Marsh Dieback was declared an emergency by Louisiana Governor Mike Foster in the form of Executive Proclamation #55-MJF-2000 issued on October 23, 2000. In response, Congress allocated approximately three million in funds through the National Atmospheric and Oceanic Administration to the Louisiana Department of Natural Resources (LDNR) to examine causes and effects of the Brown Marsh phenomenon. Black mangrove (Avicennia) made major incursions into the salt marsh.
El Niño Southern OscillationWill increase in frequency • Compaction is proportional to Southern Oscillation Index (drought) • Higher compaction - mores subsidence, greater Grey Mangrove • encroachment of salt marsh. • S. Williams - • 1997-8 El Niño in Southern California - 3oC warmer in seagrass bed • Zostera declines to 1/3 density, Ruppia proliferates • Ruppia does poorly in warm water but grows faster than Zostera, • especially without competition • Zostera does not persist over winter. • Both species provide trophic support
Increased Precipitation • Decreased soil salinity and increased water content • - increase plant growth in many wetlands • Changes in animal composition and zonation dependent on salinity • tolerance • damage from storms, flooding. • Grass zonation affected by changing salinities.
Eutrophication Current Seagrass Paradigm: Nutrient overload -- epiphyte growth -- seagrass decline (=bottom-up control) Alternative: Trophic Cascades with top down control Top predator removal ---small predators increase --- Mesograzers decline (peracarids, shrimp, gastropods, pinfish)-- Epiphytes bloom --- seagrass declines Ken Heck - 2003 ERF Meeting
Freshwater Export/Regime Shift • Striped Bass introduced to SF Bay from Hudson R. in 1879. • used as an indicator of environmental health. • Decline of Striped Bass in 1977and Delta smelt in 1982 • attributed to water exports. (smelt listed as threatened). • BUT Bill Bennet proposes there was a behavioral response to • warmer ocean water. Older individuals migrated to ocean. • (ERF 2003)
UV Damage - Bridgham et al. • Attenuation of UV radiation is an exponential function of dissolved • organic matter (DOM) concentration • UV-B penetration in darkly stained waters is limited to only a few cm. • The strongest correlate of DOM concentrations in aquatic ecosystems • is the percentage of wetlands in the watershed. • Climate change may reduce DOM concentrations in aquatic ecosystems, • thereby exacerbating UV effects, by changing the amount and flowpaths • of DOM from upland and wetland ecosystems. • Hypothesis: this linkage between wetland area and type, • DOM, and climate will be the single most important factor • determining the amount of UV damage to aquatic ecosystems • at the landscape scale