Download

1 / 45
450 likes | 759 Views
Objektif Slot. Calon memenuhi ekspektasi panel penemuduga dari semua aspek. How to succeed in your graduate study. By Khalid Abdul Hamid, PhD. Be prepared. Somebody wants to shoot you down Prepare, prepare and prepare Psychologically (Mind and Heart - Attitude)

E N D
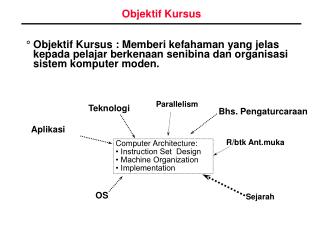
Objektif Slot • Calonmemenuhiekspektasi panel penemudugadarisemuaaspek
How to succeed in your graduate study By Khalid Abdul Hamid, PhD
Be prepared • Somebody wants to shoot you down • Prepare, prepare and prepare • Psychologically (Mind and Heart - Attitude) • Physically (Skill and knowledge, family, etc.) • Examine things you will be facing (new environments, new ways of doing things) • Make all the checklist you need to execute (prepare a file, contingencies etc.) • Mind-set change
Study • Examine your curricula • Examine how you could succeed • Examine gaps you have and work it out now
Curiosity the Basic Ingredient for Industrial Statistics Khalid.hamid@treasury.gov.my
Definition • Curiosity (from Latin curiosus "careful, diligent, curious," akin to cura "care") is a quality related to inquisitive thinking such as exploration, investigation, and ... • cu·ri·os·i·ty (ky r - s -t ). n. pl. cu·ri·os·i·ties. 1. A desire to know or learn. 2. A desire to know about people or things that do not concern one; nosiness. 3. An object ...
Basic ingredient • Basic Ingredients for Weather • eo.ucar.edu/webweather/basic.htmlCached • [Temperature] [Pressure] [Volume] [Density] [Combine Ingredients] · [Thunderstorms & Tornadoes] [Hurricanes] [Blizzards & Winter Weather] [Clouds].
Industry Statistics 1. Commodity Production Statistics In the area of industrial statistics, the United Nations Statistics Division (UNSD) is engaged in the collection and dissemination of data on the production of major industrial commodities, both in physical quantities and in monetary value. Data are mainly collected through a questionnaire sent yearly to national statistical offices. The commodities are classified according to the UN List of Industrial Products. The data collected are published in three major publications: the Industrial Commodity Statistics Yearbook, the United Nations Statistics Yearbook, and the Monthly Bulletin of Statistics. Data on Industrial Commodity Production can be obtained in the following ways: The 2008 Industrial Commodity Statistics Yearbook (2 volumes) in hardcover and PDF format. (order here) The complete dataset of Industrial Commodity Statistics, currently covering the period 1950-2008 on CD-ROM. (Contact subscriptions@un.org to order.) On-line through the UN Data portal.
Continued…. • In dealing with difficulties later in life, protecting young people from failure early in life would seem to have another negative effect. And this is in discouraging them from embarking on any endeavor where there is even the slightest risk of not succeeding. • This is reflected in the fields that the students of wealthy families are choosing to go into in college, and also in their career choices. As Tough notes “there are fewer entrepreneurs graduating from our best colleges these days; fewer iconoclasts; fewer artists; fewer everything, in fact, except investment bankers and management consultants” (loc. 3046). • And the numbers bear out what Tough is saying. Indeed, consider that “recently, the New York Times reported that 36 percent of new Princeton graduates in 2010 took jobs in the finance industry, and another 26 percent took jobs in a category that… features, prominently, management consulting…—and this [was] after the near-collapse of the finance industry in 2008. (Before the economic crisis, about three-quarters of Princeton graduates went into one of those two careers.)” (loc. 3049)
PesananPenaja • http://www.youtube.com/watch?v=UF8uR6Z6KLc&feature=player_embedded • C:\Users\Dell-3\Desktop\Desktop 27Mac2013\IO Workshop at Intan\CTt4y8bokWs-lecture-7-energy-economics-inputoutput.htm
Session 3 The Power of I-O Analysis: 3 case studies Input-Output training course, Intan4th June 2013
Content • Introduction to I-O Tables • Table versus model • Extracting structure information • Aggregating • Case studies using I-O model: • Food and Energy; • Wage and Productivity; and • Subsidy Rationalization
General background • 100 i-o users, 100 different programs • spreadsheets: • easy, but not flexible • matrix programming (Gauss, Matlab): • flexible, but not easy • input-output software: • mainly i-o construction, little i-o modelling
Purpose: easy and flexible • easy to use, Windows integrated • data input & model output, exchangeable with other software • usable for all types of i-o tables: • interregional, but also single-region and national • all standard I-O analyses covered: • descriptive statistics, linkage analyses • additional variables, flexible model extensions • multiplier and impact analyses
Basic characteristics • no table construction-use provided model • no fancy stuff you can do elsewhere (graphics) • Table files (.tbl) = only the basic I-O table • Model files (.mdl) = table + all extra information you add yourself to build your model • generalized Dimensions, no size restrictions • generalized endogenous Variables, no feedback • generalized endogenous Relations, with feedback
Install IRIOS • http://www.regroningen.nl/irios.html • Run setup • Download lab data: • http://www.regroningen.nl/lab.zip • Unzip lab.zip to your local working directory (c:\lab) • Start IRIOS • New/Model and Open/Table • Browse to c:\lab and choose “Netherlands.tbl”
Edit table • Aggregation • Distribute margins (later) • Aggregation possible over all 5 dimensions • Aggregate manufacturing and public utility into “Man_Pub” • Press Cancel when not saving the aggregated table • Aggregate Wages, Social insurance and Other Income into “Value Added” • Aggregating regions: Later • Note: there is no undo for aggregation!
Larger tables • New/Model and Open/Table • Choose “Asia 2000.tbl” • Aggregate 76 sectors into • Agriculture • Manufacturing • Services • Aggregate imports from Hongkong, EU and ROW into “total imports”
Descriptive statistics • New/Model and Open/Table • Browse to c:\lab and choose “Netherlands.tbl” • Analysis I-O table • Sector structure • Production: which is the largest sector? • Wages: which sector generates most of the wages? • Exports • All together
Descriptive statistics • Analysis I-O table • Output/Sales structure • Choose Construction • Calculate shares unaggregated: which is the largest output coefficient? • Choose all sectors • Calculate shares aggregated: intermediate versus final output • Which industry is the most orientated to intermediate sales?
Descriptive statistics • Analysis I-O table • Input/Cost structure • Choose Manufacturing • Calculate shares unaggregated: which is the largest input coefficient? • Choose all sectors • Calculate shares unaggregated: which sector has the highest input coefficient for construction? • Calculate shares aggregated: intermediate versus primary inputs • Which industry has the highest intermediate input coefficient?
Case studies: Introduction Methodology Results Recommendations
Case study 1: Food and Energy Published papers/journals/presentation: 1. Energy Price Impact on East Asian Region’s Food and Non-food Industry. Presented by Khalid Abdul Hamid at The International Conference on Economics and Finance, Kathmandu, Nepal, 20 – 22 April 2012. 2. Effect of Energy Price increase on East Asian Region’s Food Industries’ interconnectedness and Integration. Chapter 10 in Deepening Energy Market Integration for ERIA by Khalid, A.H., Zakariah, A.R. and R. Zarina R.M. (August 2011) 3. Food and Energy MACFEA 15th National Seminar, UITM Hotel, Shah Alam Selangor, 19—20 July 2011 4. Effect of Higher Oil Price to Consumer Food Products in Malaysia. Khalid, A.H., Zakariah A.R and MohdKhairulHisyam H.. Article due for publication at the MJES, Malaysian Economic Association, University of Malaya 5. The Effect of Higher oil Price on Consumer Food Products in Malaysia. Khalid, A.H., Zakariah, A.R. (Presented at the International Economic Conference, Anadolu University, Eskisehir, Turkey .Vol. 1, T2D Economics of Oil 6. Effect of Energy Price Increase on East Asian Region’s Food Industries: with special reference to Malaysian Experience. By Khalid, A.H. NEOC, Nov 23, 2011.
Case study 1: Effect of Energy Price Increase on East Asian Region’s Food Industries:with special reference to Malaysian Experience
Food and Energy (http://www.eria.org/publications/research_project_reports/deepen-understanding-and-move-forward-energy-market-integration-in-east-asia.html)
Economic Impact • Estimation of an economy’s aggregate impact shows the potential benefits of various forms of growth. As such, in times of rising oil price it shows susceptibility of the economy in question. As West (1999) explained it not the size that is important but magnitude because a small multiplier can correspond to a large total impact and a large multiplier to a small impact in an economy depending on the size of initial changes in the final demand. • The word impact may seem ambiguous since it can be used in various contexts such as effect, result, incidence, significance, contribution, consequence and importance. In the pursuit of measuring the energy price impact, the primary focus will be on output changes in the oil and non-oil industries, sales patterns, new commitments or investments, alterations of economic commitment or assessing current economic significance of established industries. All these can be traced by the total impact analysis via final demand, multipliers, linkages and the extended Leontief‟s price system.
SectoralInflationary Rates • The following Table 4.25 presents the share of each sector in household expenditure or total private consumption (C), the share of each sector in total gross output (Q), and the share of each sector in GDP (VA) in the 41 x 41 sector Malaysian I-O Table 2000 and 1978. This is achieved by transforming each share into weights and multiplying by each sector’s price, output or VA share, i.e. • C = P1 (C1/C*) + P2 (C2/C*) +……. + P41 (C41/C*) = ΣPC • Q = P1(X1/X*) + P2 (X2/X*) +……. + P41 (X41/X*) = ΣPX • VA= P1(VA1/VA*) + P2 (VA2/VA*) +…….+ P41(VA41/VA*) = ΣPVA
Table 4.25: Sectoralinflation rate, 1978 and 2000 (in percent)
Aggregate Household Expenditure, Gross Output and GDP The following table shows the overall impact of price perturbations on the household expenditure (PC), the cost of output (PQ) and GDP price deflator (PVA). These inflationary costs cuts across the aggregated CPI, output and value added of the price system in aggregate form as shown below.
Estimating the retail price of food • The price-spread model is a short-run model which classifies 10-food-industries to estimate the impact of changes of input prices onto consumer food product prices. It assume that consumers do not respond to retail price changes, whilst food producers do not alter input proportions despite changes in relative input prices. • Furthermore, output of each industry serves only as a final consumer of food products. In our price-spread model, we compute 10 components of food industries in each EA country as categorized in their respective CPI to estimate price changes on retail price. Each firm of the respective 10 final food industries produces a single product by combining a farm commodity with a set of non-farm inputs in fixed proportions. • In this model, consumer demand is fixed for all levels of retail price. These simplifying assumptions reduce the computation of a food price estimate to an evaluation of an accounting-type formula. This formula states that the percentage change in the retail price is a weighted sum of the percentage changes in input prices, with cost shares (e.g. from the Malaysian I-O tables, 2005) serving as weights: PR* = PF*sF + Px*sx .…. (5) • where sF and sx represent the cost shares of food and non-food inputs, respectively, and where PR*, PF*, Px*denote the percentage changes in the retail, the food price, and the aggregate non-food price, respectively. The variable Px is the food marketing cost index (FMCI), or the average price of the aggregate non-food input. The above formula asserts that a 1-per cent increase in the FMCI leads to a sx-per cent increase in the retail price.
Cont…. Energy is one of several non-food inputs used to produce food, and the price of energy is approximately about one-twelfth of non-food input prices used to construct the FMCI (i.e.Px). Suppose that food is produced using a single food input and a single aggregate or representative non-food input, with a price equal to the FMCI. If this single non-food input is produced from individual non-food inputs in fixed proportions, the retail price formula given by equation (5) above can be extended directly to: PR* = PF*sF + Px*sx = PF*sF + (PE*sE + Pi*si) sx ……. (6) where sE andsi are the non-food cost shares of energy and the ith non-food input, and PE* and Pi* are the percentage changes in energy and the other non-farm input prices, respectively. The sum in the parentheses of equation (6) represents the percentage change in the FMCI (i.e., Px*), and the shares of each term serve as weights on the individual input prices. Equation (6) states that the percentage increase in the consumer price of food is the weighted sum of the percentage change in the price of the food ingredient, the energy price, and the other non-food input prices comprising the FMCI. At this point, it is convenient to describe the main difference between the price-spread and intensity models. The term, PE*sE in equation (6) is referred to as the direct effect because it denotes the energy cost increase incurred by producers of the aggregate marketing input. cPi*si, ……(7) The second term is referred to as the indirect effect because it measures the effect of a rising energy price on the costs of other inputs used in producing the marketing input. For example, because energy is used to produce food packaging, the cost of packaging will rise with higher energy prices. In a typical price-spread model simulation, the indirect effects would be zero since the price of energy does not affect the price of other marketing inputs. In a typical I-O model simulation, a change in the price of crude oil could affect the price of all other inputs used in the production of food. Since we wish to impose the same exogenous change on the two models, we include the indirect effects of energy increase in both model simulations. In particular, we used the I-O model’s prediction of the percentage change in energy intensity whilst also using the FMCI in the price-spread model to estimate the effect of a doubling of the crude oil price. The price-spread model simulation suggests that a doubling of the price of crude oil leads to a 1.119 per cent increase in FMCI in 2005. This predicted increase in the FMCI is an average of total intensity of two important energy sectors’ total impact. This assumption simplifies that each industry’s output serves only at that respective final consumer of food product. Thus, we can examine each of the 10 components of food industry’s retail price changes from an increase in energy price. • The weights are the derived from averaging the inverse matrix of two main energy-related sectors’. • SxPF*SFis the direct effect of the energy price increase on the average cost of producing the food product.
Sectoralfood price effects • Relative prices across sectors of the EA economy performed differently. Increased in the energy price generates more costs in terms of generating value added and importing input in producing food and non-food output. This has consequences on policies concerning interconnectedness of energy inputs along food and non-food corridors. • Food productions in developed EA countries are lower than average total effect, nevertheless, these sectors generate greater value added. Thus, they are more resilient to energy price increases; • In contrast, developing EA countries’ food productions are higher than total effect, however, generate less value added; and • Agricultural-based countries with low technology have low value-added. Thus, local value added has limits in using new techniques.
Retail price: • A rise in energy prices has direct and indirect effects on an economy. The lower an economy’s energy inputs, the lower the effect from energy price increases and likewise. Additionally, such economy’s have greater potential in nurturing efficiency and diversification with lower food intake and thus exhibit smaller effects in retail prices; • The price-spread effects in terms of energy use, non-food costs share and CPI differ across food items; and • The higher the effect of an increase in the oil price, the greater the retail price. This occurs through channels of food marketing such as transportation, packaging and so on.
Sectoral Price effects • Relative prices across sectors of the EA economy performed differently. Increased in the energy price generates more costs in terms of generating value added and importing input in producing food and non-food output. This has consequences on policies concerning interconnectedness of energy inputs along food and non-food corridors. • Food productions in developed EA countries are lower than average total effect, nevertheless, these sectors generate greater value added. Thus, they are more resilient to energy price increases; • In contrast, developing EA countries’ food productions are higher than total effect, however, generate less value added; and • Agricultural-based countries with low technology have low value-added. Thus, local value added has limits in using new techniques.
Retail price: • A rise in energy prices has direct and indirect effects on EA economies. The lower an economy’s energy inputs, the lower the effect from energy price increases. Additionally, such economy’s have greater potential in nurturing efficiency and diversification with lower food intake and thus exhibit smaller effects in retail prices; • The price-spread effects in terms of energy use, non-food costs share and CPI differ across food items; and • The higher the effect of an increase in the oil price, the greater the retail price. This occurs through channels of food marketing such as transportation, packaging and so on.
Case 2: Wage and Productivity • Effect of wage and energy price change on Malaysian industrial development. Khalid A.H., Zakariah A.R. and R. Zarina R.M. Malaysian Institute of Economic Research, Kuala Lumpur. Proceedings of the Malaysian National Economic Conference July 2012 and due for publication in JEM, UKM. • Identifying key sectors of high income advanced economy for Malaysia: A comparison between sectoral and NKEA approaches by Khalid Abdul Hamid and Zakariah Abdul Rashid, July 2012. (Edited UUM’s Paper)
Case 3: Subsidy Rationalization • Economic Impacts of Subsidy Rationalization Malaysia by Khalid Abdul Hamid and Zakariah Abdul Rashid MIER, Malaysia. Chapter 9: in Energy Market Integration in East Asia: Theories, Electricity Sector and Subsidies By Yanrui Wu, Xunpeng Shi, Fukunari Kimura (Eds.) ERIA Research Project Report 2011-17 (August 2012). • Subsidy Internal Briefing Note: Rationalization of Fossil Fuel Subsidy in Malaysia. By Khalid Abdul Hamid, MIER. For IISD, Geneva. January 2012. Web add: http://www.iisd.org/gsi/resources/citizens-guide-energy-subsidies-malaysia • Economic Impact of Higher Oil price in Malaysia: Integrated Input-Output Analysis. Khalid Abdul Hamid, Doctor of Philosophy, UPM 2010. • Effect of Higher Oil Price to Consumer Food Products in Malaysia. Khalid, A.H., Zakariah, A.R and Mohd Khairul Hisyam H.. Article due for publication at the MJES, Malaysian Economic Association, University of Malaya. • The Effect of Higher oil Price on Consumer Food Products in Malaysia. Khalid, A.H., Zakariah, A.R. (Presented at the International Economic Conference, Anadolu University, Eskisehir, Turkey .Vol. 1, T2D Economics of Oil.
11 things you need to do when study abroad • Make friends with locals • Travel around • Take opportunity to increase your knowledge • Share the knowledge with new neighbours • Learn new traits • Enjoys the facilities • Shop • Sale • Go to movies • Experience their delicacies • Learn, unlearn and relearn (for flexibility)
Thriving in Graduate School • You made it! Now the real work begins. • Take advantage of all that the campus has to offer. Marymount, for instance, extends all kinds of services to graduate students—the Center for Teaching & Learning, counseling, study abroad, multimedia services, etc. • Connect with other students juggling home/work/school. Some universities have graduate student associations that facilitate peer support and lobby on students’ behalf. • Build relationships with your professors. The University of Washington offers good practice guidelines. • Befriend your librarians. They can make your life as a researcher so much easier. Universities often have institutional subscriptions to online bibliographic management programs—at Marymount, RefWorks —that save useful citations for multiple bibliographies. • Prepare for your career as intensely as you prepared for graduate school. Hone your writing and presentation skills. Learn how to organize your work and your time. Seek out opportunities – advice.pdf • to present—on campus, in the community, and at conferences. • to publish —everywhere. Work your way up to an academic journal in your field. • to network. • Pat yourself on the back now and then. You are on your way to becoming one of the roughly 12 percent of Malaysian who hold a graduate or professional degree.
Parting notes Be Creative, Innovative and committed in your works. It’s the signal of success. Makes things simple, but not easy. Be moderate which does not mean slow and procrastinate. Finally, said Keynes in his remark on the economy “"In the long run we are all dead”. Says Islamic economy "in the long run we need to grow a seed even we know that the world is going to an end.