Download
1 / 25
250 likes | 344 Views
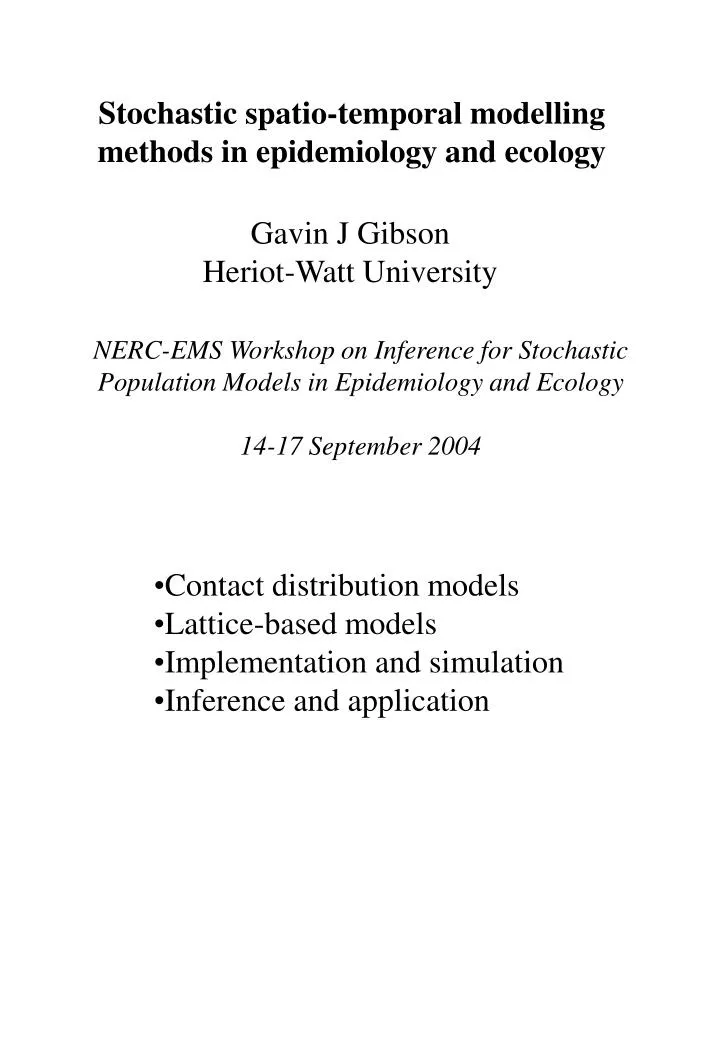
Stochastic spatio-temporal modelling methods in epidemiology and ecology. Gavin J Gibson Heriot-Watt University. NERC-EMS Workshop on Inference for Stochastic Population Models in Epidemiology and Ecology 14-17 September 2004. Contact distribution models Lattice-based models

E N D
Stochastic spatio-temporal modelling methods in epidemiology and ecology Gavin J Gibson Heriot-Watt University NERC-EMS Workshop on Inference for Stochastic Population Models in Epidemiology and Ecology 14-17 September 2004 • Contact distribution models • Lattice-based models • Implementation and simulation • Inference and application
Contact distribution models for population spread (individual-based, pure birth process) • Assumptions: • Each individual in the population produces offspring according to Poisson process with rate l. • Offspring displaced from parent by vector r chosen randomly from a probability distribution f(r) the contact distribution. Time between births (for individual) are i.i.d. Exp(l) random. offspring Parent r
Often we choose f to be radially symmetric. Therefore simulation involves choosing a radius, r, from a distribution along with an angle q uniformly in (0, 2p). New offspring placed at x + (r cosq, r sinq) where x is parent’s position. If we choose r2 to have an Exp(l) distribution then r will be a BVN(0, I/(2l)) distribution. The qualitative nature of spatial distributions of the populations we generate depends on the properties of f. If f is light-tailed, births will tend to be close to parents. If heavy-tailed, significant probabilities of births displaced a long way from parents. (See pictures later.)
Adding complexity: • Survival probabilities of offspring related to local density • Death/removal of individuals • Consumption of resources • Environmental heterogeneity • Heterotropic dispersal (prevailing winds, etc.)
Lattice-based epidemic models, forest-fire models are natural developments of contact distribution models x y Infective challenge Fq(x, y) Stochastic SI spatio-temporal model: Pr(Ix(t + dt) = 1 | Ix(t) = 0) = Ix(t) “Infectious status of individual located at x at time t.” q is vector of parameters
Examples of F include: • a nearest-neighbour interaction • Fq(x, y) = be-a|x – y| • Fq(x, y) = b|x-y|-2a • Extensions of the model include: • Finite infective period (spatio-temporal SIR or SIS model) • Addition of latent period (spatio-temporal SEIR model) • Pre-symptomatic period • Addition of further transmission routes e.g.primary infection corresponding to infection from external sources. • Studying spatio-temporal models by simulation is relatively straightforward.
Simulation of a simple SI process on a lattice • At time t, infective set Y = {y | Iy(t) = 1}. To compute time and location of next infection: • For each susceptible, x, calculate its total infection rate • Choose time till next infection T ~ Exp(SxR(x)) • Choose location x with probability proportional to R(x). • Update t and Y and go back to 1.
If interactions exponentially bounded then emerging patterns start to look essentially like expansion of foci. Wave dynamics result. Heavy-tailed interaction functions produce patterns that are ‘patchy’. Apparent expansion from several foci. When using models for prediction it is important to be able to estimate characteristics of spatial interaction functions.
What about inference? Suppose we observe the process through time – how can we estimate parameters? Given complete data {x, t(x)} we can calculate a likelihood L(q) = “Pr({x, t(x)} | q)”. Example: nearest-neighbour interaction Fq(x, y) = q if x and y are NN, 0 otherwise. Observed over period [0, 2] 1.0 0.8 0 0.5 Numbers denote observed infection times.
In this way a likelihood can be built up. However, we don’t observe populations continuously in practice. In a real experiment infection times would be censored (known to lie within some interval) e.g. if we observe infected set at distinct observation times t1, t2, …, tn. The problem is now one involving missing data. Problem can be solved in a Bayesian framework. Let y be the observations and x the exact times of infection. Then investigate p(q, x |y) p(q)f(x, y|q) using MCMC. An example (1):Citrus tristeza virus. (see GJG, Applied Statistics 1997)
Data: 2 snapshots of the epidemic at times 1 year apart (Marcus et al.) Aims: Understand spatial aspects of transmission. • Models:simple SI spatio-temporal with interactions • Fq(x, y) = be-a|x – y| • Fq(x, y) = b|x-y|-2a A simplification: Suppose we did the following experiment. Giventhe locations of the 1st 131 infections, record the locations the next 45 infections (without measuring times or orderings). Call this set of locations X and let W denote the set of all possible orderings of those locations.
For this experiment the likelihood L(q|X) = Therefore we can forget about b, since sets of infected sites and orderings thereof are independent of it. Estimate a in Bayesian framework by investigating p(w, a| X) p(a)Pr(w|a) by MCMC. (See GJG, 97) • Consider a discrete parameter space for a. • Updates to a can be done by a Gibb’s step. • Updates to w can be done by Metropolis methods by proposing swaps to adjacent pairs in the ordering.
Extensions: Single patterns can be analysed if we propose a model for the diseased set at an earlier time. For example, we might assume that the epidemic arises from a single infection randomly placed in the population.
An example (2): • R. Solani (fungal pathogen) in radish (host) • Host plants infected through: • primary infection (inoculum in soil); • secondary infection from previously infected plants; • Infectivity/susceptibility varies as plants develop. • Experiments aim to quantify the dynamics of spread and how they depend on a range of factors (inoculum density, presence of bio-control, etc.)
Microcosm experiments Small experimental populations, highly controlled conditions Lattice of seeds in sandy matrix Primary inoculum (randomly placed) Observe over time Symptomatic seedling
Spatio-temporal model for symptom progress • The model uses a percolation approach. • The population is represented as being located at the vertices of a square latticeL • At time t = 0, a subset X0 Lis inoculated with the fungus. Any x X0 develops symptoms at time T ~ Exp(a) (if not already symptomatic) • Secondary infection is nearest-neighbour • If x develops symptoms at time t, then neighbour y develops symptoms at t + Txy where • Txy ~ Exp(f(b, t)) (if not already symptomatic). Txy are independent over y (c.f. bond percolation) x y (cf. Filipe et al.B. Math. Biol. (2004))
Application of model to microcosm data • All cases 18 x 23 grid of plants, tmax – 21days, roughly daily sampling: • High inoculum: 45 randomly chosen sites • Low inoculum: 15 randomly chosen sites • Patterns not always connected so that purely n-n transmission gives vanishing likelihood! Add small infection rate (10-7) for ‘spurious’ primary infection. • Some sites fail to germinate • Histogram estimates of posterior densities for 4 parameters, based on 105 iterations.
Missing O, Primary inoc. + Symptomatic day 9 X
Parameter estimation using MCMC • (Gibson et al. (submitted)) • Main features: • Propose (independent) priors for a, b0, b1, b2; • Investigate joint posterior • p(q, x| y) p(q)L(q |x, y) Daily recordings Precise infection times MCMC methods uses mixture of Gibb’s steps and Metropolis steps to investigate this posterior density.
High inoculum Low inoculum
High inoculum Low inoculum
High inoculum Low inoculum
High inoculum Low inoculum
Conclusions? • Little evidence of differences between the treatments • Evidence of within-treatment differences between replicates • Clear evidence of a non-stationarity in secondary infection rates • But ….. all this depends on how appropriate the model is. How can we assess the fit of spatio-temporal models and select between competing models in any given scenario?
Summing up: • Growing body of methodology for fitting spatio-temporal stochastic models to data. • Maximise insights in studies where spatial information is recorded • Essential for assessing control strategies for spatio-temporal processes • More advanced applications, increasing complexity (see e.g. Lara Jamieson’s talk) • Many challenges! Inferences only as good as the model is appropriate.