Download
1 / 10
100 likes | 233 Views
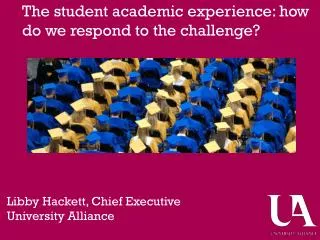
The student academic experience: how do we respond to the challenge?. Libby Hackett, Chief Executive University Alliance. 2014 Student Academic Experience Survey report – some figures. . 86% overall satisfaction rate 52.1% 36.3% value for money

E N D
The student academic experience: how do we respond to the challenge? Libby Hackett, Chief Executive University Alliance
2014 Student Academic Experience Survey report – some figures 86% overall satisfaction rate 52.1% 36.3% value for money 48% would redirect investment into reducing fees
What I’m going to say: responding to the challenge… • Let’s hear from the students • Quality will keep rising up the agenda • Value for money
Breadth and depth of university experience – more than just a degree
How is quality currently secured? More safeguards than ever before Statutory protection “university” Key Information Sets Unistats Internal validation Subject benchmarks Framework of HE Qualifications UK Quality Code Collaborative approach Shared responsibility External examiners Internal student questionnaires National Student Survey League tables SLC funding in three instalments CUC Code of Practice QAA review every six years QAA themed reviews Student engagement PSRBs Internal complaints procedure OIA Cause for concern procedure European qualifications framework
Managing quality in an expanding system: • Regulation Parity for all students • Managing risk Student success
Value for money / Transparency • £9,000 fee • But a 45% RAB subsidy • 50:50 share of investment overall • £5,000 average graduate contribution
Australia HEPI report: Clear water Uni_funding
Thank you www.unialliance.ac.uk @unialliance libby@unialliance.ac.uk