Download
1 / 22
230 likes | 422 Views
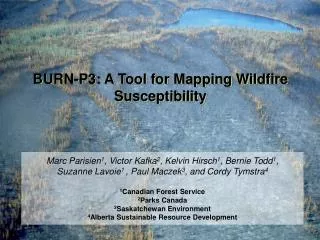
BURN-P3: A Tool for Mapping Wildfire Susceptibility. Marc Parisien 1 , Victor Kafka 2 , Kelvin Hirsch 1 , Bernie Todd 1 , Suzanne Lavoie 1 , Paul Maczek 3 , and Cordy Tymstra 4 1 Canadian Forest Service 2 Parks Canada 3 Saskatchewan Environment 4 Alberta Sustainable Resource Development.

E N D
BURN-P3: A Tool for Mapping Wildfire Susceptibility Marc Parisien1, Victor Kafka2, Kelvin Hirsch1, Bernie Todd1, Suzanne Lavoie1 , Paul Maczek3, and Cordy Tymstra4 1Canadian Forest Service 2Parks Canada 3Saskatchewan Environment 4Alberta Sustainable Resource Development
Burn-P3 (Probability, Prediction, and Planning) A tool that provides a quantitative estimate of wildfire susceptibility (i.e., burn probability) for large fire-prone landscapes • BURN-P3maps the wildfire susceptibility: • of the current landscape • under variable burning conditions • applying historical variability
General Design Number of escaped fires per year NUMBER OF ESCAPED FIRES DISTRIBUTION Burn probability (BP) = Number of times each cell burned 100% Number of iterations Draw number of escaped fires for one iteration Simulate all fires of the iteration individually AREA BURNED GRID FOR EACH ITERATION Repeat for n iterations ADD TO CUMULATIVE AREA BURNED GRID FOR COMPLETED ITERATIONS
Burn probability (%) Burn probability map
Potential Uses of BURN-P3 • Strategic planning of fire management activities • Locate areas of limited suppression effectiveness • Identify potential wildland-urban interface problems • Evaluating the role of fuels management strategies • Model their potential effectiveness (i.e., reduction in BP) • Optimize their location on the landscape • Optimizing forestry planning • Prioritize areas according to wildfire risk • Optimize the timing and layout of cutblock design • Road construction: facilitate fire management operations
Data inputs • Required inputs: • Historical weather • Fuel type grid • Optional inputs: • Slope, elevation, aspect grids • Historical or probable ignition locations • Fire frequency distribution • Fire duration distribution • Weather zones
Forest B Forest A 25 km Burn probability (%)
Burn-P3 • Burn-P3 application • Download it from here: • ftp://ftp.nofc.cfs.nrcan.gc.ca/fire/BURN_P3/ • No administrative privileges required for installation! • Prometheus COM license required • Collaborators • Canadian Forest Service • Alberta Sustainable Resource Development • Saskatchewan Environment • Parks Canada • Canadian Interagency Forest Fire Centre