Download
1 / 13
130 likes | 261 Views
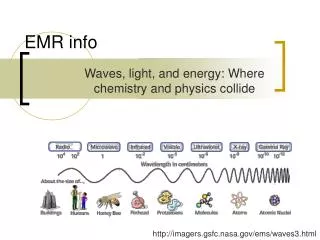
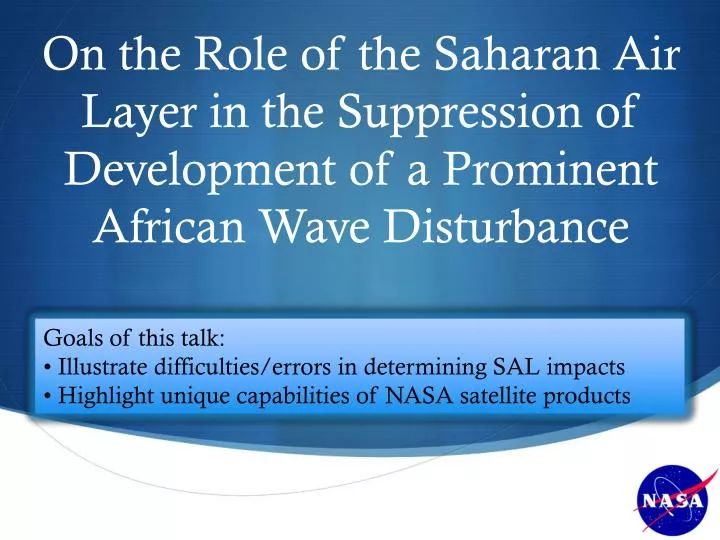
On the Role of the Saharan Air Layer in the Suppression of Development of a Prominent African Wave Disturbance. Scott A. Braun NASA/GSFC. Goals of this talk: • Illustrate difficulties/errors in determining SAL impacts • Highlight unique capabilities of NASA satellite products.

E N D
On the Role of the Saharan Air Layer in the Suppression of Development of a Prominent African Wave Disturbance Scott A. Braun NASA/GSFC Goals of this talk: • Illustrate difficulties/errors in determining SAL impacts • Highlight unique capabilities of NASA satellite products
Studies finding a negative impact of the SAL • Dunion and Velden (2004)—Suggested that negative impacts were associated with increased: • Deep-layer shear associated with the AEJ • High stability associated with the elevated SAL • Cold downdrafts due to dry SAL air • Jones et al. (2007), Wu (2007), Shu and Wu (2009), Reale et al. (2009) among others all suggested negative SAL impact, but with very weak evidence and some false assumptions
Common Incorrect Assumptions Braun (2010) found little evidence for a frequent negative impact in a composite analysis of 41 storms. Satellite data analysis suggests common assumptions in previous studies: • Dry tropical air is SAL air • The SAL is dry throughout its depth • Guilt by proximity Braun, S. A., 2010: Re-evaluating the role of the Saharan Air Layer in tropical cyclone genesis and evolution. Mon. Wea. Rev., (in press).
An Example A recent study by Reale et al. (JAS, 2009) suggested that the SAL prevented development of a promising tropical wave Mid- latitude air SAL Core Of W1
Is The Dry Tongue SAL? Data used for analysis • TRMM multi-satellite precipitation (0.25° resolution, 3-hourly) • MODIS (Terra and Aqua) Level-3 aerosol optical depth (AOD) (1° resolution, daily) • AIRS/AMSU Level-2 temperature and relative humidity profiles (54 km resolution, twice daily) • NCEP Global Forecast System (GFS) final analyses (1° resolution, 6-hourly)
Evolution of the SAL August 25, 2006 August 26, 2006 August 27, 2006 August 28, 2006
AIRS Data August 27, 2006 600 hPa Temperature 700 hPa Temperature 700-600 hPa Relative Humidity 600-500 hPa Relative Humidity 850 hPa Temperature 850-700 hPa Relative Humidity
Trajectory Calculations 6-Day backward air trajectories at every grid point using 1°, 6- hourly GFS data Air parcels traced back to the Sahara are shaded gray (left). Total descent along trajectories is shaded (right) August 26, 2006 August 24, 2006 August 25, 2006 Thick black curve: AOD=0.2 Thick purple curve: AOD=0.4 Contours: RH <50 blue/black, 60-70 dashed red, >80 red
Interpretation of Satellite Imagery The SAL is not necessarily always dry Dry tropical air is not necessarily SAL air Role of the SAL: SAL impacts or dry subsiding air? GOES SAL analyses do not necessarily uniquely identify SAL air
Conclusions • Beware the false assumptions • Warm and dry air masses can be caused by subsidence as well as, or instead of, the SAL • GOES and TPW imagery not sufficient to diagnose SAL air • More comprehensive approach combining MODIS, AIRS, CALIPSO, and even trajectories may often be needed to diagnose SAL air • Proximity of the SAL is insufficient evidence for impact—direct evidence of causation is needed Scott.A.Braun@nasa.gov
AIRS and CALIPSO DataAugust 26 AOD=0.4 AOD=0.2
Evolution of the MODIS AOD, TRMM precipitation, and GFS 700-hPa heights and wave-relative winds SAL2 SAL2 Debby SAL2 Debby SAL1 Debby SAL1 SAL1 SAL1