Download
1 / 15
160 likes | 350 Views
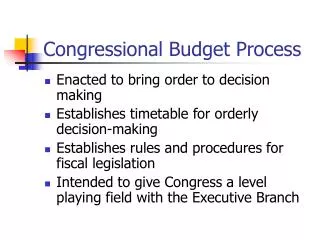
Congressional Budget Office. Presentation to the National Health Policy Conference The Outlook for Health Care Spending February 4, 2008. Excess Cost Growth in Medicare, Medicaid, and All Other Spending on Health Care. Percentage Points.

E N D
Congressional Budget Office Presentation to the National Health Policy Conference The Outlook for Health Care Spending February 4, 2008
Excess Cost Growth in Medicare, Medicaid, and All Other Spending on Health Care Percentage Points
Projected Spending on Health Care as a Percentage of Gross Domestic Product Percent
Federal Spending Under CBO’s AlternativeFiscal Scenario Percentage of Gross Domestic Product
Federal Debt Held by the Public as a Percentage of Gross Domestic Product Under CBO’s Long-Term Budget Scenarios
Federal Fiscal Imbalance Under CBO’s Long-Term Budget Scenarios Percentage of Gross Domestic Product
Contribution of Aging to the Fiscal Gap Under CBO’s Alternative Fiscal Scenario Percentage of Gross Domestic Product
$7,200 to 11,600 (74) 6,300 to < 6,800 (55) 4,500 to < 5,800 (72) 6,800 to < 7,200 (45) 5,800 to < 6,300 (60) Not Populated Medicare Spending per Capita in the United States, by Hospital Referral Region, 2003 Source: www.dartmouthatlas.org.
The Relationship Between Quality and Medicare Spending, by State, 2004 Composite Measure of Quality of Care Source: Data from AHRQ and CMS.
What Additional Services Are Provided in High-Spending Regions? Source: Elliot Fisher, Dartmouth Medical School.
Variations Among Academic Medical Centers Use of Biologically Targeted Interventions and Care-Delivery Methods Among Three of U.S. News and World Report’s “Honor Roll” AMCs Source: Elliot Fisher, Dartmouth Medical School.
Medicare Advantage Enrollment and Spending is Growing Rapidly
Source: CBO Note: Coordinated care plans includes HMOs, PPOs, and POS plans. Other group includes 1876 cost plans, healthcare pre-payment plans, and demonstrations.
Employer Plans are Driving PFFS Growth • "PFFS plans also are attractive to employers and unions throughout the country, because they can readily provide coverage nationwide, including coverage that is adaptable to seasonal changes in residence. Roughly 15 percent of PFFS enrollment in 2007 derives from employer group and union plans, compared to just 5 percent in 2006. One of the largest additions to PFFS employer group enrollment for 2007 was the Michigan Public School Employees Retirement System, which has close to 100,000 retirees." • Abby L. Block, (Director, Center for Beneficiary Choices, CMS), Testimony on Medicare Advantage Private Fee-For-Service Plans before the W&M Health Subcomm, May 22, 2007 • “Dear Provider: Your patient is enrolled in DESERET SECURE, our new Medicare Advantage Private Fee-for-Service plan. Beginning January 1, 2007, Deseret Secure (and Deseret Secure PLUS, which includes a higher prescription drug benefit) replaces all our existing plans for our members on Medicare, including our HCPP and Medicare supplement products." • Letter from Deseret Mutual Benefit Administrators (established in 1970 to serve the employee insurance and retirement needs of employees of the Church of Latter-day Saints).
CBO Health Activities • New Hires and Expanded Staffing • New deputy assistant director (Keith Fontenot) in the Budget Analysis Division • Health staff agency wide increase from 30 FTEs to 40 FTEs (Plus 6 new hires) • FY 2009 Plans • Reports and Analysis in 2008 • Critical Topics in Health Reform • Health Options