Automated Measurements of Methane and Carbon Dioxide Fluxes in Sub-Arctic Mire Ecosystems
This study investigates greenhouse gas emissions, focusing on methane (CH4) and carbon dioxide (CO2) fluxes in a sub-Arctic mire ecosystem in Sweden. Utilizing automated chamber measurements, we analyze the dynamics of gas exchange under varying light conditions. Our findings illustrate significant variability in CH4 emissions linked to landscape transitions from dry permafrost areas to wet habitats dominated by Eriophorum spp. Additionally, we explore the isotopic composition of emitted CH4, shedding light on biogeochemical processes affecting greenhouse gas dynamics in northern peatlands.

Automated Measurements of Methane and Carbon Dioxide Fluxes in Sub-Arctic Mire Ecosystems
E N D
Presentation Transcript
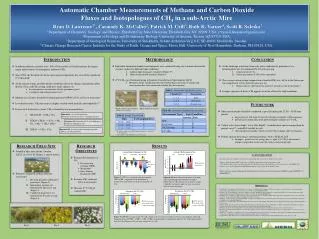
Automatic Chamber Measurements of Methane and Carbon Dioxide Fluxes and Isotopologues of CH4 in a sub-Arctic MireRyan D. Lawrence1*, Carmody K. McCalley2, Patrick M. Crill3, Ruth K. Varner4, Scott R. Saleska2 1Department of Chemistry, Geology, and Physics, Elizabeth City State University, Elizabeth City, NC 27909, USA. (*ryan.d.lawrence@gmail.com) 2Department of Ecology and Evolutionary Biology, University of Arizona, Tucson, AZ 85719, USA. 3Department of Geological Sciences, University of Stockholm, Svante Arrhenius Va ̈g 8 C, SE-10691 Stockholm, Sweden. 4 Climate Change Research Center, Institute for the Study of Earth, Oceans and Space, Morse Hall, University of New Hampshire, Durham, NH 03824, USA. • Introduction • Northern peatlands currently store ~30% of the world’s soil carbon and are the largest single natural source of atmospheric methane (CH4) • Since 2000, the Swedish sub-Arctic mean annual temperature has crossed the significant 0 C threshold1 • As the climate warms, possible positive feedbacks driven by changes in peatland carbon dioxide (CO2) and CH4 cycling could have major impacts on • the atmospheric concentrations of both greenhouse gases2 • cryospheric and ecological processes1 • Methane has 62 times the global warming potential (GWP) of CO2 at 20 year timescales3 • In wetland systems, CH4 emissions are highly variable (both spatially and temporally)4,5 • In terrestrial freshwater systems, CH4is formed by two main pathways: • CH3COOH → CH4 + CO2 • 2CH2O + 2H2O→ 2CO2 + 4H2CO2+ 4H2→ CH4+ 2H2O • 2CH2O → CH4 + CO2 • Methodology • Individual automated chamber measurements were conducted using two 5 minute interval lid closures, under two different light conditions: • Ambient light [transparent chamber] (Figure 5*) • Darkened [shrouded chamber] (Figure 6) • δ13C-CH4was determined using a Quantum Cascade Laser Spectrometer (QCL) • Methane isotopic composition derived from Keeling regressions of isotope and concentration data from automated chamber flux measurement • Conclusion • As the landscape transitions from a dry palsa, underlain by permafrost, to a predominately wet site dominated by Eriophorum spp. • Sequestration of CO2 • Increasing amount of CH4 to the atmosphere • The average carbon isotope composition of emitted CH4 was -68 ‰ at the Sphagnum site compared to -62 ‰ at the Eriophorumsite • Depicts relative shift from CO2-reductive towards acetate fermentation 6 • Isotopic signature of derive CH4 appears to not be affected by light conditions Table I. Automated Chamber Ecosystem • Future work • More measurements should be conducted, especially during the 21:00 – 03:00 time period • larger data sets will begin to offset the the high variability of CH4 emissions • provide more information about potential impact of light on δ13C-CH4 • Collect active layer depth8, water table depth4,9, chamber plant species composition by percent cover8,6, and pH8 if suitable for site • Aforementioned variables shown to affect CH4 exchange and CO2 dynamics • Further analyze data using a statistical package, such as SPSS or SAS • Example : paired t-test of average day vs. night δ13C-CH4 to determine if isotopic composition of derived CH4 source is affected by light Fig. 5 Ambient light chamber*chamber lid open in photo Fig. 6 Darkened chamber Table III. Automated Chamber Measurements Equation I: Acetate Fermentation; dominates freshwater systems 6 / Eriophorum sites 7 Table II. Sample Time Period Equation II: Reduction of CO2 with Hydrogen; dominates Sphagnum sites 7 Equation III: Overall reaction encompassing both pathways of CH4 production * In addition, entire automated chamber system was calibrated every 90 minutes. * One complete cycle (Chamber 1-9) is three hours. • Research Objectives • Examine the dynamics of CO2 • Net ecosystem exchange (NEE) • Respiration • Gross Primary Production (GPP) • Examine CH4 exchange • Flux measurements • Measure δ13C-CH4of emitted CH4 • Research Field Site • Stordalen Mire near Abisko, Sweden (68°21' N, 19°03' E) (Figure 1, shown below) • Primarily composed of three different ecosystems: • Elevated, dry palsa underlain by permafrost) (Figure 2) • Intermediate moisture site dominated by Sphagnumspp. (Figure 3) • Completely thawed wet site dominated by Eriophorum spp. (Figure 4) • Results Acknowledgement First and foremost, I would like to thank God for without him truly none of this would have been possible. Thanks to Mr. E. Froburg, NERU collaborators,and NSF for making this research experience possible. To Ms. Kaitlyn Steele, I most graciously appreciate the selflessness actions and contributions to the overall success of the NERU 2012. Figures 1- 4 provided by Maria Paula (MP) Mugnani..Figures 5 & 6 provided by Dr. Ruth K. Varner. This research was supported through the Northern Ecosystems Research for Undergraduates (NERU) program (NSF REU site EAR#1063037). Figure 7) GPP was calculated using the equation GPP = NEE – respiration. From permafrost to Eriophorum, more plants result in overall uptake of CO2. Figure 8) Methane flux measurements were made under ambient light and shrouded conditions. Differences in CH4 emission occur; however, high variability and small sample size may reason that result in observed change. References [1] Callaghan, T. V., F. Bergholm, T. R. Christensen, C. Jonasson, U. Kokfelt, and M. Johansson (2010), A new climate era in the sub-Arctic: Accelerating climate changes and multiple impacts, Geophys. Res. Lett., 37, L14705, doi:10.1029/2009GL042064. [2] Nykänen, H., J. E. P. Heikkinen, L. Pirinen, K. Tiilikainen, and P. J. Martikainen (2003), Annual CO2 exchange and CH4 fluxes on a subarctic palsa mire during climatically different years, Global Biogeochem. Cycles, 17(1), 1018, doi:10.1029/2002GB001861. [3]Houghton, J. T., Y. Ding, D. J. Griggs, M. Noguer, P. J. van der Winden, and X. Dai (2001), Climate Change 2001: The Scientific Basis. Contri- bution of Working Group 1 to the Third Assessment Report, Cambridge Univ. Press, New York. [4] Bubier, J., T. Moore, K. Savage, and P. Crill (2005), A comparison of methane flux in a boreal landscape between a dry and a wet year, Global Biogeochem. Cycles, 19, GB1023, doi:10.1029/2004GB002351. [5] Joabsson, A., and T. R. Christensen (2001), Methane emissions from wet- lands and their relationship with vascular plants: An Arctic example, Global Change Biol., 7(8), 919–932 [6] Bäckstrand, K., Crill, P. M., Jackowicz-Korczyñski, M., Mastepanov, M., Christensen, T. R., and Bastviken, D. (2009), Annual carbon gas budget for a subarctic peatland, northern Sweden, Biogeosciences Discuss., 6, 5705-5740, doi:10.5194/bgd-6-5705-2009. [6] Whiticar M.J. (1999), Carbon and hydrogen isotope systematics of bacterial formation and oxidation of methane. Chem Geol 161: 291-314. [7] Lansdown J. M., Quay E D. and King S. L. (1992), CH4 production via CO2 reduction in a temperate bog: A source of 13C depleted CH4. GeochimCosmochimActa 56: 3493-3503. [8] Bubier, J. L., T. R. Moore, L. Bellisario, N. T. Comer, and P. M. Crill (1995), Ecological controls on methane emissions from a Northern peatland complex in the zone of discontinuous permafrost, Manitoba, Canada, Global Biogeochem. Cycles, 9(4), 455–470. [9] Updegraff, K. (2001), Response of CO2 and CH4 emissions from peatlands to warming and water table manipulation, Ecol. Appl., 11(2), 311–326. Figure 9 & 10) The averages of all δ13C-CH4 within each cover type are similar; however, measurements conducted during the hours of 09:00 – 15:00 vs. 21:00 – 03:00 may potentially be significantly different. Yet, CH4 high variability may heavily influence results of small sample size (n = 24). Fig. 2) Fig. 3) Fig. 4)