Download
1 / 11
180 likes | 489 Views
Displacement, Velocity, and Acceleration Graphs. Introduction. Many concepts in physics are based on velocity and acceleration This includes everything from gravity to work and power

E N D
Introduction • Many concepts in physics are based on velocity and acceleration • This includes everything from gravity to work and power • These concepts also help us understand the movement of objects in flight the orbits of the planets as well as numerous other natural phenomenon • Both velocity and acceleration of an object can be determined through an understanding of a displacement over time graph.
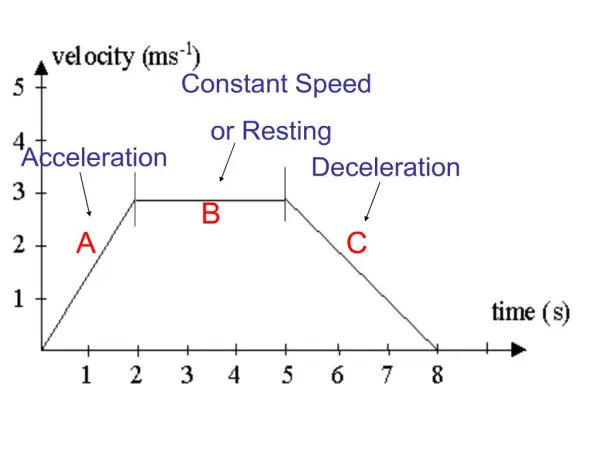
Displacement Graph • To the left are the distances of the object from its starting point (0). • To the right are the same values represented graphically. • The slope of this graph is the object’s velocity.
Understanding Slope • Slope is defined as the rise over the run and can be expressed mathematically as: • For points (x1,y1) and (x2,y2) on the same line the slope is • This can also be understood as the rate of change. • For our purposes we will understand slope as (x2-x1)/(t2-t1) • This can be read as the change is displacement over the change in time.
Finding the Velocity • So the first point is at (0,0) and the second at (1,1), so to find the velocity we • (1-0)/(1-0)=1/1=1, so at the first point of the velocity graph is at (1,1) as well • To find the second point, we just repeat the process with (1,1) and (2,4) • (4-1)/(2-1)=3/1=3, so the second point of the velocity graph is at (2,3)
Velocity • To the left are the speeds of the object at one second intervals. • To the right, that information is represented graphically. • We can now use this information to tell us what the acceleration of the object is.
Finding the Acceleration • Acceleration can be found the same way, that we found Velocity from our displacement graph.
Acceleration • To the left are represented the acceleration of the object at one second intervals • To the right those values are represented graphically. • We can see from this graph that the object is accelerating at a constant rate
Understanding the Units • Displacement is measured in units of length • In science this is typically in meters, a metric unit which is roughly equal to a yard • Velocity is measured in length per time. • Typically this is in meters per second (m/s), this tells how many meters is covered every seconds • So if a bird covered 10 meters in 5 seconds, its velocity would be 2m/s • Mathematically: V=10m/5s=2m/s • Another unit of Velocity is Miles per Hour (mph) which is the usual way to measure the speed of cars in America, and tells how many miles would be covered in an hour if the car were to remain at a constant speed.
Understanding Units cont. • Acceleration is measured in length per time per time • Typically this is in meters per second per second (m/s/s or m/s2), this tells how much the velocity changed in a second • So if a bird accelerated from 8m/s to 10m/s in 1 second, the acceleration would be 2m/s2 because the bird increased its velocity by 2m/s in 1 second. • Mathematically A=(10m/s-8m/s)/1s=(2m/s)/1s • 2m/s2