Download
1 / 21
210 likes | 343 Views
AMP, Inc.: Order Entry and Fulfillment. Background Business Process Redesign: Process, IT Key Performance Indicators Implications: Process, IT. AMP: BACKGROUND. AMP Is a Leading Global Supplier of Connection Devices to Many Complex Electric/Electronic Markets. AMP:

E N D
AMP, Inc.: Order Entry and Fulfillment • Background • Business Process Redesign: Process, IT • Key Performance Indicators • Implications: Process, IT
AMP: BACKGROUND AMP Is a Leading Global Supplier of Connection Devices to Many Complex Electric/Electronic Markets • AMP: • Has $3 billion in annual sales of electric/electronic connectors • Owns an 18% share in an $18 billion market: • Very complex product offering with more than 100,000 SKUs • It is very profitable: 1991 gross income of 33% of sales • Organized into 19 units that serve very diverse end-use markets through direct and distributor channels: • Aerospace/military - Computers/office equipment - Government systems • Industrial/commercial - Consumer good - Government systems • Communications - Transportation/electrical - Advanced cables/ interconnection • Each unit owns from one to five plants, totaling 85 plants in U.S. alone
AMP: BACKGROUND AMP Has Experienced Sustained Sales and Income Growth AMP, Inc. • AMP has grown faster (CAGR revenues = 14%) than the connection device industry (12%) • AMP is considered one of the best-in-class U.S. producers that holds Far East and European producers at bay Revenues Net Income ($ million) ($ million)
AMP: BACKGROUND AMP Faces a Very Challenging Business Environment • Concentration of suppliers • Threat of forward integration(e.g., DuPont, 3M) • Over 6,000 customers with more than 100,000 SKUs in over 235 product families • Slowing end-user growth • End-user supplier rationalization efforts • “Commoditization” of product in some markets • Growing emphasis on price and product availability • Growing power of distributors over products Product/Customers AMP Inc. Suppliers • Extreme price competition: • Eight aggressive players, including DuPont, 3M, and ITT • Competitor initiatives to improve product quality,delivery time and service Competitors • AMP’s vision is to provide customers with products and services so outstanding that it will become the “Supplier of Choice.”
AMP: BUSINESS PROCESS AMP Historical Order Entry and Fulfillment Processes Suffered from Key Weaknesses • Order Entry: • No real prioritization of customer requests • High percentage of customer calls blocked (busy) and abandoned • Different procedures across businesses • Inconsistent policies regarding product returns • People scattered across businesses and warehouses—few economies of scale • Paper-intensive process: • For products not available in their warehouse, CSRs took customers’ requests down and called them back later • Order fulfillment: • Low productivity • Product obsolescence and error rates • Need to adjust finished goods to reflect physical inventories
AMP: BUSINESS PROCESS The “Plan for Excellence” Program Involved a Redesign of AMP’s Business Processes Key Questions “Plan for Excellence” (kicked off in 1988/89) • How do we provide superior customer service? • How can we provide superior product delivery and availability? • How can we improve our cost base? • How can order entry and fulfillment improve quality? • The program built on a dozen independent initiatives conducted in the 1980s: • Productivity improvement • Total quality improvement • It became part of AMP’s vision and enjoyed top management support • Emphasized leadership, communications, training, and improvement: • Introduced objectives measurement systems • Looked for aggressive implementation
AMP: BUSINESS PROCESS AMP Redesigned Its Order Entry Process to Respond to Customer Calls Immediately and Completely • Supported customer profiles and pricing • Migrated key customers to EDI • Provided early warning to key accounts • Installed a hotline for key customers Focus on Key Customer Needs Order Entry Business Process and IT • Placed all order entry under a “logistics” organization • Integrated a few independent businesses—each of which had its own approach—to use identical process and systems • Consolidated most of the order entry in two locations, achieving very high productivity gains • Implemented foolproof order entry protocols • Trained personnel extensively • Developed single return policies across divisions = + Consolidated Customer Service Activities +
AMP: BUSINESS PROCESS AMP Redesigned Its Order Entry Process to Respond to Customer Calls Immediately and Completely (cont.) • Linked offices to back up each other (e.g., Central to cover East Coast if overloaded) • Linked offices and manufacturing sites through systems • Instituted auditing procedures Implemented Management Processes + Order Entry Business Process and IT(cont.) Enhanced Invoicing • Derived prices and conditions from customer files • Use EDI for key client invoicing • Make invoice data available online = + • Expanded phone line and switching capacity • Greatly enhanced order entry: • Provided on-line view of all warehouses and scheduled production runs • Enabled “reserved” material status • Expanded EDI functionality Installed Enhanced Technology
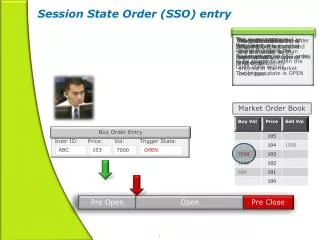
Dialogue with one of 200 production schedulers through E-mail: PF Key AMP: BUSINESS PROCESS For Example, the Order Entry Process Allows Real-Time Responses to Key Customer Requests Real Time Order Entry Assigned CSR Team (10 CSRs) Product in any AMP warehouse? Fulfill order; ship or reserve product Discuss with plant schedulers to expedite YES Customer Calls with Product Request Frequent Caller NO NO Product being released from plant next week? Satisfactory answer from scheduling? Reserve product Promise delivery YES YES If Loaded, Backup Not Frequent Caller NO Product in production schedule? (8 weeks) Call Distributor Based on Industry and Product Code Suggest delivery date YES NO Date acceptable to customer? Stock at AMP distributor? (on line search) NO Fill from distributor Inventories NO YES Reserve Product YES
MRP II AMP: BUSINESS PROCESS Order Entry Business Process Placed New Demands on IT Connectivity An IT View of Order Entry Order Entry: CSR Manufacturing Plants Order Fulfillment Warehouse Access Production Schedules Share Finished Goods Inventories Distributor Warehouse Share Finished Goods Inventories Can Access AMP Distributor Inventories • Growth of EDI (20% of all volume) and faxes also creates new demands.
AMP: BUSINESS PROCESS The Redesigned Order Entry Process Translates into Minimal Customer-Call Losses Customer Service Phones Percentage of Calls Blocked (Busy) Percentage of Calls Abandoned After Pick-Up (Hang-Ups)
AMP: BUSINESS PROCESS It Results in Fewer Order Entry Errors, Higher Staff Productivity, and Increased Customer Satisfaction Cost of Clerical Errors Percentage of Key Customers Satisfied on Initial Call ($ million) 1/90 3/90 1/91 3/91 1/92 3/89 1/90 3/90 1/91 3/91 1/92 3/92 Quarter /Year Quarter /Year Bookings per Customer Service Staff ($ million)
AMP: BUSINESS PROCESS AMP’s New Order Fulfillment Process Seeks to Provide Superior Availability and Delivery of Orders • Implemented a network of master and regional warehouses • Closed regional warehouses and stocking points • Built an automated distribution center in Schaumburg • Asked independent businesses to move to AMP warehouses Consolidated Warehouse Network + • Made warehouse staff more sensitive to customer needs • Developing interactive training programs (e.g., video training) • Hired or trained logistics professionals to run operations • Rotated personnel throughout warehouse areas: • Creating a career path in logistics Strengthened Staffing Order Fulfillment Business Process and IT = + • Increased use of customer forecasts • Standardized inventory carrying cost formulas • Developed optimization algorithms • Defined inventory levels (e.g., minimum lot sizes) to minimize cost of stockouts Strengthened Core Finished Product Procedures +
AMP: BUSINESS PROCESS AMP’s New Order Fulfillment Process Seeks to Provide Superior Availability and Delivery of Orders (cont.) • Developed a real-time system to track materials across warehouses • Implemented effective shipping routines: • For regular orders • For emergencies • Revised policy and procedures for return of goods • Implemented auditing and control procedures Enhanced Order Fulfillment Activities + Order Fulfillment Business Process and IT Enhanced Packaging and Labeling • Redesigned packaging: • Developed standard color scheme • Introduced bar-coded labels displaying quantity and part number on all carrying units = + • Developed interfaces between computer systems (e.g., tied order entry to plants’ MRP II) • Computerized warehouses • Invested in portable bar-code readers Strengthened IT Support to Process
AMP: BUSINESS PROCESS AMP Has Strengthened the Training of Its Staff Number of People That Are Certified by APICS
AMP: BUSINESS PROCESS The Redesigned Order Fulfillment Process Exhibits Greater Efficiency Warehouse Productivity Inventory Turns per Year (Lbs./Man Year) Shipping Errors Expenses $300,000 High Range $120,000 Low Range
AMP: BUSINESS PROCESS AMP Now Provides Best-in-Class Order Fulfillment Independent Survey of Competitors’ On-Time Delivery Rates (1991) Percentage of Orders Shipped by Customer Request Dates a DuPont 3M Augat Molex LPL • When measured against its own promised dates, AMP has achieved a 95% on time delivery. a. Bishop and Associates, December 1991.
AMP: PERFORMANCE INDICATORS AMP Has Implemented Comprehensive Metrics to Measure Progress Order Entry Percentage of Transactions Correctly Entered Percentage of Customers Satisfied on First Call Percentage of Calls Blocked Percentage of Calls Abandoned Clerical Errors ($) Bookings Per CSR ($) Percentage of Transactions “Real Time” Order Fulfillment Percentage of On-Time Shipments (to Customer Request) Percentage of On-Time Shipments (to AMP Schedule) Number of Customer Disputes Shipping Errors ($) Pounds/ Person Year Inventory Turns Spillage Percentage Percentage Repackaged
AMP: PERFORMANCE INDICATORS Successful Implementation Has Won AMP High Marketplace Satisfaction AMP Customers’ Overall Satisfaction Level (Percentage That Rated AMP’s Service Excellent or Very Good) 1989 1991 78% 91% • At the same time that it increased customer satisfaction, AMP increased order entry and distribution center productivity by 25% to 50%.
AMP: IMPLICATIONS AMP Learned Some Critical Lessons from their Business Process Redesign • One organization should ultimately be responsible for all order entry and fulfillment activities: • “We put 1,100 people together in a new logistics organization and one person accountable for it” • Need to introduce tracking system • It’s a complex change management project: • “The complexity is overpowering: we had a 35 feet by 20 feet PERT chart” • There is a gut-wrenching organizational and systems change • It requires “out of the box” thinking... • “Complex algorithms to optimize inventories with minimal costs” • . . . And top management support: • “CEO and top managers need to go over numbers at least every month to see progress”
AMP: IMPLICATIONS AMP Also Learned Some Information Technology Lessons • New business process and IT support had to be implemented concurrently, not sequentially • No “off-the-shelf” package offered the flexibility required by AMP to redesign its processes • Three years of developing systems…and still going • Technology investments were necessary at many levels: • Call management system at switchboards • Interfaces and date exchange across several platforms and applications • Bar-code readers and processors at warehouses • AMP spent over $75 million in systems; payback came in only two years.