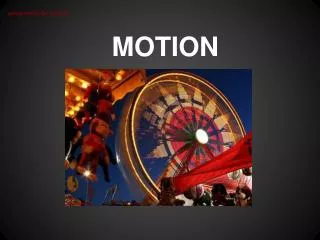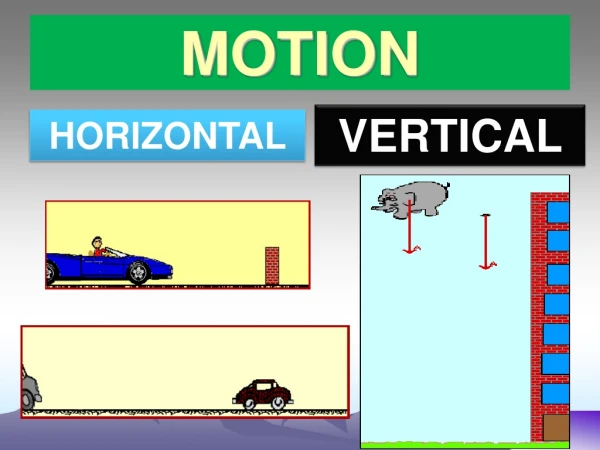
Motion
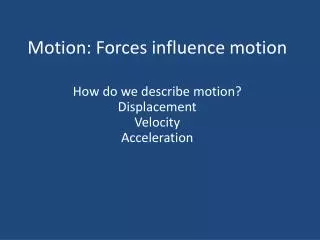
Motion. Unit 1: Motion Chapter 2: Describing Motion. 2.1 Position, Velocity, and Acceleration 2.2 Position vs. Time Graphs 2.3 Velocity vs. Time Graphs. Key Question: How are position, speed, and velocity related?. 2.1 Investigation: Position, Speed, and Velocity. Objectives:

Motion
E N D
Presentation Transcript
Unit 1: MotionChapter 2: Describing Motion • 2.1 Position, Velocity, and Acceleration • 2.2 Position vs. Time Graphs • 2.3 Velocity vs. Time Graphs
Key Question: How are position, speed, and velocity related? 2.1 Investigation: Position, Speed, and Velocity Objectives: • Measure positive and negative positions. • Measure positive and negative velocity. • Compare speed and velocity.
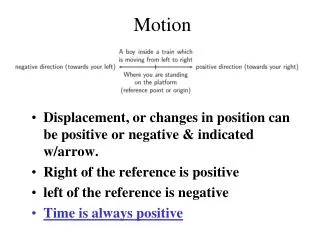
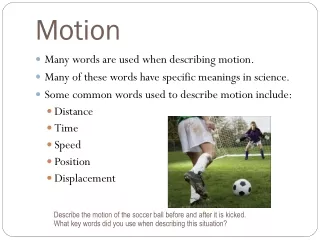
Position, Velocity, and Acceleration • Position is a variable. • Position and distance are similar but not the same. Both use units of length. • Position is given relative to an origin. If a car moves 20 cm, what is it’s new position?
Position and displacement • A change in position is called displacement. • A displacement of –20 cm means the car leaves the 50-cm mark and moves toward the origin. • A displacement of 20 cm means the car moves away from the origin.
Velocity • The velocityof an object (v) tells you both its speed and its direction of motion. • Velocity can be positive or negative, so it includes information about the moving object’s direction. • Constant velocitymeans that both the speed and the direction an object is traveling remains constant.
Positive velocity • The sign for velocity is based on the calculation of a change in position. • The change in position is the final position minus the initial position.
Negative velocity • Negative velocity means the position is decreasing relative to the starting point.
Average and instantaneous velocity • Average velocityis the total displacement divided by the total time taken. • Instantaneous velocitydescribes the velocity of an object at one specific moment in time or at one specific point in its path.
Relative velocity • Relative velocitydescribes the velocity of an object with respect to a frame of reference. • If you are sitting in a chair, you are not moving relative to Earth, but you are moving at about 67,000 mph relative to the Sun.
Using relative velocity A people mover has a velocity of 1 m/s and is 150 m long. If a man walks 2 m/s relative to the people mover, how long will it take him to reach the opposite end if he walks in the direction that the people mover travels? • Looking for: …the time in seconds. • Given:… velocity of the people mover (1 m/s), the relative velocity of the walker (2 m/s), and the displacement (150 m). • Relationship:Use this version of the velocity equation: t = Δx ÷ v • Solution: t = 150 m ÷ (1 m/s + 2 m/s) = 150 m ÷ 3 m/s = 50 s
Acceleration • Accelerationis the rate at which velocity changes.
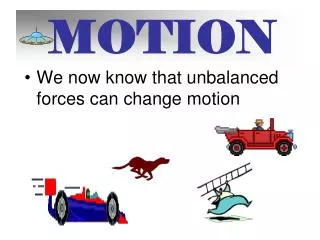
Acceleration • Acceleration and velocity are completely different ways to describe an object’s motion. • An object can be accelerating when its velocity is zero. • Like velocity, acceleration can be positive or negative. • An object will have a positive acceleration when it is speeding up in the positive direction, and when it is slowing down in a negative direction.
Calculating acceleration A sailboat moves at 1 m/s. Wind increases its velocity to 4 m/s in 3 seconds. Calculate the acceleration. • Looking for:.. the acceleration in m/s/s. • Given:… the initial velocity (vi=1 m/s), final velocity (vf=4 m/s), and time (t=3 s) • Relationship:Use: a = (vf – vi) ÷ t • Solution: a = 4 m/s – 1 m/s = 3 m/s = 1 m/s 3 s 3 s
Units of acceleration • An acceleration in “meters per second per second (m/s/s) is often written m/s2 or meters per second squared.
Unit 1: MotionChapter 2: Describing Motion • 2.1 Position, Velocity, and Acceleration • 2.2 Position vs. Time Graphs • 2.3 Velocity vs. Time Graphs
Key Question: How are graphs used to describe motion? 2.2 Investigation: Position, Velocity, and Time Graphs Objectives: • Create graphs of velocity versus position and time. • Create a predictive model for the velocity of car rolling down a hill.
Position vs. Time Graphs • Motion graphs are an important tool used to show the relationships between position, velocity, acceleration, and time. • Graphs help test drivers and engineers see how much of the straight track each car covered in equal time intervals. • Drivers can make adjustments in how they operate cars.
Slope • The slope of a line is the ratio of the “rise,” or vertical change, to the “run,” or horizontal change. • The rise is equal to the height of the triangle. • The run is equal to the length along the base of the triangle.
Position vs. Time Graphs • A position vs. time graph can tell you whether an object’s velocity is constant or changing. (Both cars have constant velocity, but Car A is faster than Car B.) • If the velocity is constant, the graph is a straight line with a constant slope.
Position vs. time graphs of accelerated motion • If the velocity is changing, the slope changes, so the graph curves.
Position vs. time graphs of accelerated motion • The graph of an object slowing down is also curved. • An example is a car coming to a gradual stop at a red light.
Unit 1: MotionChapter 2: Describing Motion • 2.1 Position, Velocity, and Acceleration • 2.2 Position vs. Time Graphs • 2.3 Velocity vs. Time Graphs
Key Question: What happens to the velocity of an object as it moves downhill? 2.3 Investigation: Position, Velocity, and Time Graphs Objectives: • Explain the motion of the Energy Car, in terms of velocity and acceleration, as it moves along an inclined track. • Infer the meaning of acceleration from a velocity versus time graph. • Apply the acceleration formula to solve problems.
Velocity vs. time graphs • The velocity vs. time graph has velocity on the y-axis and time on the x-axis. • On this graph, constant velocity is shown with a straight horizontal line.
Velocity vs. time graphs • The velocity vs. time graph is the best tool for understanding acceleration. • It clearly shows how the velocity of an object changes with time.
Constant acceleration • The velocity vs. time graph shown is for a ball in free fall. • Since the ball is accelerated by gravity, it’s velocity increases by the same amount: 9.8 m/s2. • What is the velocity of the ball after 4 seconds? Ans: 29.4 + 9.8 = 39.2 m/s2 ,down
Constant acceleration • Don’t confuse constant velocity with constant acceleration. • Constant velocity means an object’s positionchanges by the same amount each second. • Constant acceleration means an object’s velocitychanges by the same amount each second.
Calculating acceleration • The slope of a velocity vs. time graph represents the acceleration of the object.
Calculating acceleration • The slope of a graph is equal to the ratio of rise to run. • The riseis the amount the velocitychanges. • The run is the amount the time changes.
Calculating acceleration from a graph Calculate the acceleration shown on the graph. • Looking for:… the acceleration in m/s/s. • Given:… a graph of velocity vs. time • Relationship:The acceleration is equal to the slope of the line. • Solution: slope = rise = 40 m/s = 4 m/s2 run 10 s
Displacement • The velocity vs. time graph gives us a way to calculate the object’s displacement even when its velocity is changing. • The displacement is equal to the area on the graph.
Direction • To show direction on a velocity vs. time graph, we must include a portion of the graph that shows negative velocities.
The more we learn about how animals interact with their environments, the better decisions we can make about how we use the oceans. High Tech Animal Trackers • Satellite tagging research studies have led to many new laws and guidelines governing human activities around endangered species.