Download
1 / 35
350 likes | 498 Views
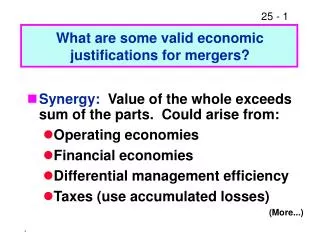
The Value of Synergy. Aswath Damodaran. Valuing Synergy. The key to the existence of synergy is that the target firm controls a specialized resource that becomes more valuable if combined with the bidding firm's resources. The specialized resource will vary depending upon the merger:

E N D
The Value of Synergy Aswath Damodaran
Valuing Synergy • The key to the existence of synergy is that the target firm controls a specialized resource that becomes more valuable if combined with the bidding firm's resources. The specialized resource will vary depending upon the merger: • In horizontal mergers: economies of scale, which reduce costs, or from increased market power, which increases profit margins and sales. (Examples: Bank of America and Security Pacific, Chase and Chemical) • In vertical integration: Primary source of synergy here comes from controlling the chain of production much more completely. • In functional integration:When a firm with strengths in one functional area acquires another firm with strengths in a different functional area, the potential synergy gains arise from exploiting the strengths in these areas.
Valuing operating synergy (a) What form is the synergy expected to take? Will it reduce costs as a percentage of sales and increase profit margins (as is the case when there are economies of scale)? Will it increase future growth (as is the case when there is increased market power)? ) (b) When can the synergy be reasonably expected to start affecting cashflows? (Will the gains from synergy show up instantaneously after the takeover? If it will take time, when can the gains be expected to start showing up? )
A procedure for valuing synergy (1) the firms involved in the merger are valued independently, by discounting expected cash flows to each firm at the weighted average cost of capital for that firm. (2) the value of the combined firm, with no synergy, is obtained by adding the values obtained for each firm in the first step. (3) The effects of synergy are built into expected growth rates and cashflows, and the combined firm is re-valued with synergy. Value of Synergy = Value of the combined firm, with synergy - Value of the combined firm, without synergy
Synergy Effects in Valuation Inputs If synergy is Valuation Inputs that will be affected are Economies of Scale Operating Margin of combined firm will be greater than the revenue-weighted operating margin of individual firms. Growth Synergy More projects:Higher Reinvestment Rate (Retention) Better projects: Higher Return on Capital (ROE) Longer Growth Period Again, these inputs will be estimated for the combined firm.
Valuing Synergy: Compaq and Digital • In 1997, Compaq acquired Digital for $ 30 per share + 0.945 Compaq shares for every Digital share. ($ 53-60 per share) The acquisition was motivated by the belief that the combined firm would be able to find investment opportunities and compete better than the firms individually could.
Background Data Compaq Digital Current EBIT $ 2,987 million $ 522 million Current Revenues $25,484 mil $13,046 mil Capital Expenditures - Depreciation $ 184 million $ 14 Expected growth rate -next 5 years 10% 10% Expected growth rate after year 5 5% 5% Debt /(Debt + Equity) 10% 20% After-tax cost of debt 5% 5.25% Beta for equity - next 5 years 1.25 1.25 Beta for equity - after year 5 1.00 1.0 Working Capital/Revenues 15% 15% Tax rate is 36% for both companies
Valuing Compaq Year FCFF Terminal Value PV 1 $1,518.19 $1,354.47 2 $1,670.01 $1,329.24 3 $1,837.01 $1,304.49 4 $2,020.71 $1,280.19 5 $2,222.78 $56,654.81 $33,278.53 Terminal Year $2,832.74 $38,546.91 • Value of Compaq = $ 38,547 million • After year 5, capital expenditures will be 110% of depreciation.
Combined Firm Valuation • The Combined firm will have some economies of scale, allowing it to increase its current after-tax operating margin slightly. The dollar savings will be approximately $ 100 million. • Current Operating Margin = (2987+522)/(25484+13046) = 9.11% • New Operating Margin = (2987+522+100)/(25484+13046) = 9.36% • The combined firm will also have a slightly higher growth rate of 10.50% over the next 5 years, because of operating synergies. • The beta of the combined firm is computed in two steps: • Digital’s Unlevered Beta = 1.07; Compaq’s Unlevered Beta=1.17 • Digital’s Firm Value = 4.5; Compaq’s Firm Value = 38.6 • Unlevered Beta = 1.07 * (4.5/43.1) + 1.17 (38.6/43.1) = 1.16 • Combined Firm’s Debt/Equity Ratio = 13.64% • New Levered Beta = 1.16 (1+(1-0.36)(.1364)) = 1.26 • Cost of Capital = 12.93% (.88) + 5% (.12) = 11.98%
Combined Firm Valuation Year FCFF Terminal Value PV 1 $1,726.65 $1,541.95 2 $1,907.95 $1,521.59 3 $2,108.28 $1,501.50 4 $2,329.65 $1,481.68 5 $2,574.26 $66,907.52 $39,463.87 Terminal Year $3,345.38 Value of Combined Firm = $ 45,511
The Value of Synergy • Value of Combined Firm wit Synergy = $45,511 million • Value of Compaq + Value of Digital = 38,547 + 4532 = $ 43,079 million • Total Value of Synergy = $ 2,432 million
Digital: Valuation Blocks Value of Firm - Status Quo = $ 2,110 million + Value of Control = $ 2,521 million Value of Firm - Change of Control = $ 4,531 million + Value of Synergy = $ 2,432 million Total Value of Digital with Synergy = $ 6,963 million
Estimating Offer Prices and Exchange Ratios • There are 146.789 million Digital shares outstanding, and Digital had $1,006 million in debt outstanding. Estimate that maximum price you would be willing to offer on this deal. • Assume that Compaq wanted to do an exchange offer, where it would exchange its shares for Digital shares. Assuming that Compaq stock is valued at $27 per share, what would be the exchange ratio?
Evaluating Compaq’s Offer Value of Digital with Synergy = $6,963 mil - Value of Cash paid in deal = $ 30 * 146.789 mil shrs = $4,403 mil - Digitial’s Outstanding Debt (assumed by Compaq) $1,006 mil Remaining Value $ 1,554 mil / number of Shares outstanding 146.789 = Remaining Value per Share $ 10.59 Compaq’s value per share at time of Exchange Offer $ 27 Appropriate Exchange Ratio = 10.59/27 = 0.39 Compaq shares for every Digital share Actual Exchange Ratio = 0.945 Compaq shares/Digital Share
Citicorp + Travelers = ? Citicorp Travelers Citigroup Net Income $ 3,591 $ 3,104 $ 6,695 BV of Equity $ 20,722 $ 20,736 $ 41,458 ROE 17.33% 14.97% 16.15% Dividends $ 1,104 $ 587 $ 1,691 Payout Ratio 30.74% 18.91% 25.27% Retention Ratio 69.26% 81.09% 74.73% Expected growth 12.00% 12.14% 12.07% Growth Period 5 5 5 Beta 1.25 1.40 1.33 Risk Premium 4.00% 4.00% 4.00% MV of Equity (bil) 81 84 165.00 Cost of Equity 11.00% 11.60% 11.31% Beta - stable 1.00 1.00 1.00 Growth-stable 6.00% 6.00% 6.00% Payout-stable 65.38% 59.92% 62.85% DDM $ 70,743 $ 53,464 $ 124,009 DDM/share 155.84 46.38
The Right Exchange Ratio • Based upon these numbers, what exchange ratio would you agree to as a Citicorp stockholder? • The actual exchange ratio was 2.5 shares of Travelers for every share of Citicorp. As a Citicorp stockholder, do you think that this is a reasonable exchange ratio?
Financial Synergy • Sources of Financial Synergy • Diversification: Acquiring another firm as a way of reducing risk cannot create wealth for two publicly traded firms, with diversified stockholders, but it could create wealth for private firms or closely held publicly traded firms. • Cash Slack: When a firm with significant excess cash acquires a firm, with great projects but insufficient capital, the combination can create value. • Tax Benefits: The tax paid by two firms combined together may be lower than the taxes paid by them as individual firms. • Debt Capacity: By combining two firms, each of which has little or no capacity to carry debt, it is possible to create a firm that may have the capacity to borrow money and create value.
I. Diversification: No Value Creation? • A takeover, motivated only by diversification considerations, has no effect on the combined value of the two firms involved in the takeover. The value of the combined firms will always be the sum of the values of the independent firms. • In the case of private firms or closely held firms, where the owners may not be diversified personally, there might be a potential value gain from diversification.
II. Cash Slack • Managers may reject profitable investment opportunities if they have to raise new capital to finance them. • It may therefore make sense for a company with excess cash and no investment opportunities to take over a cash-poor firm with good investment opportunities, or vice versa. • The additional value of combining these two firms lies in the present value of the projects that would not have been taken if they had stayed apart, but can now be taken because of the availability of cash.
Valuing Cash Slack • Assume that Netscape has a severe capital rationing problem, that results in approximately $500 million of investments, with a cumulative net present value of $100 million, being rejected. • IBM has far more cash than promising projects, and has accumulated $4 billion in cash that it is trying to invest. It is under pressure to return the cash to the owners. • If IBM takes over Netscape Inc, it can be argued that the value of the combined firm will increase by the synergy benefit of $100 million, which is the net present value of the projects possessed by the latter that can now be taken with the excess cash from the former.
III. Tax Benefits (1) If one of the firms has tax deductions that it cannot use because it is losing money, while the other firm has income on which it pays significant taxes, the combining of the two firms can lead to tax benefits that can be shared by the two firms. The value of this synergy is the present value of the tax savings that accrue because of this merger. (2) The assets of the firm being taken over can be written up to reflect new market value, in some forms of mergers, leading to higher tax savings from depreciation in future years.
Valuing Tax Benefits: Tax Losses • Assume that you are Best Buys, the electronics retailer, and that you would like to enter the hardware component of the market. You have been approached by investment bankers for Zenith, which while still a recognized brand name, is on its last legs financially. The firm has net operating losses of $ 2 billion. If your tax rate is 36%, estimate the tax benefits from this acquisition. • If Best Buys had only $500 million in taxable income, how would you compute the tax benefits? • If the market value of Zenith is $800 million, would you pay this tax benefit as a premium on the market value?
Valuing Tax Benefits: Asset Write Up • One of the earliest leveraged buyouts was done on Congoleum Inc., a diversified firm in ship building, flooring and automotive accessories, in 1979 by the firm's own management. • After the takeover, estimated to cost $400 million, the firm would be allowed to write up its assets to reflect their new market values, and claim depreciation on the new values. • The estimated change in depreciation and the present value effect of this depreciation, discounted at the firm's cost of capital of 14.5% is shown below:
Congoleum’s Tax Benefits Year Deprec'n Deprec'n Change in Tax Savings PV before after Deprec'n 1980 $8.00 $35.51 $27.51 $13.20 $11.53 1981 $8.80 $36.26 $27.46 $13.18 $10.05 1982 $9.68 $37.07 $27.39 $13.15 $8.76 1983 $10.65 $37.95 $27.30 $13.10 $7.62 1984 $11.71 $21.23 $9.52 $4.57 $2.32 1985 $12.65 $17.50 $4.85 $2.33 $1.03 1986 $13.66 $16.00 $2.34 $1.12 $0.43 1987 $14.75 $14.75 $0.00 $0.00 $0.00 1988 $15.94 $15.94 $0.00 $0.00 $0.00 1989 $17.21 $17.21 $0.00 $0.00 $0.00 1980-89 $123.05 $249.42 $126.37 $60.66 $41.76
IV. Debt Capacity • Diversification will lead to an increase in debt capacity and an increase in the value of the firm. • Has to be weighed against the immediate transfer of wealth that occurs to existing bondholders in both firms from the stockholders.
Valuing Debt Capacity • When two firms in different businesses merge, the combined firm will have less variable earnings, and may be able to borrow more (have a higher debt ratio) than the individual firms. • In the following example, we will combine two firms, with optimal debt ratios of 30% each, and end up with a firm with an optimal debt ratio of 40%.
Effect on Costs of Capital of Added debt Firm A Firm B AB -No AB - Added New Debt Debt Debt (%) 30% 30% 30% 40% Cost of debt 6.00% 5.40% 5.65% 5.65% Equity(%) 70% 70% 70% 60% Cost of equity 13.60% 12.50% 12.95% 13.65% WACC - Year 1 11.32% 10.37% 10.76% 10.45% WACC- Year 2 11.32% 10.37% 10.76% 10.45% WACC- Year 3 11.32% 10.37% 10.77% 10.45% WACC-Year 4 11.32% 10.37% 10.77% 10.45% WACC-Year 5 11.32% 10.37% 10.77% 10.45% WACC-after year 5 10.55% 10.37% 10.45% 9.76%
Effect on Value of Added Debt Firm A Firm B AB -No new AB - Added Debt Debt FCFF in year 1 $120.00 $220.00 $340.00 $340.00 FCFF in year 2 $144.00 $242.00 $386.00 $386.00 FCFF in year 3 $172.80 $266.20 $439.00 $439.00 FCFF in year 4 $207.36 $292.82 $500.18 $500.18 FCFF in year 5 $248.83 $322.10 $570.93 $570.93 Terminal Value $5,796.97 $7,813.00 $13,609.97 $16,101.22 Present Value $4,020.91 $5,760.47 $9,781.38 $11,429.35 • The value of the firm, as a consequence of the added debt, will increase from $9,781.38 million to $11,429.35 million.
Empirical Evidence on Synergy • If synergy is perceived to exist in a takeover, the value of the combined firm should be greater than the sum of the values of the bidding and target firms, operating independently. V(AB) > V(A) + V(B) • Bradley, Desai and Kim (1988) use a sample of 236 inter-firm tender offers between 1963 and 1984 and report that the combined value of the target and bidder firms increases 7.48% ($117 million in 1984 dollars), on average, on the announcement of the merger. • Operating synergy was the primary motive in one-third of hostile takeovers. (Bhide)
Operational Evidence on Synergy • A stronger test of synergy is to evaluate whether merged firms improve their performance (profitability and growth), relative to their competitors, after takeovers. • McKinsey and Co. examined 58 acquisition programs between 1972 and 1983 for evidence on two questions - • Did the return on the amount invested in the acquisitions exceed the cost of capital? • Did the acquisitions help the parent companies outperform the competition? • They concluded that 28 of the 58 programs failed both tests, and 6 failed at least one test. • KPMG in a more recent study of global acquisitions concludes that most mergers (>80%) fail - the merged companies do worse than their peer group. • Large number of acquisitions that are reversed within fairly short time periods. bout 20.2% of the acquisitions made between 1982 and 1986 were divested by 1988. In studies that have tracked acquisitions for longer time periods (ten years or more) the divestiture rate of acquisitions rises to almost 50%.
Who gets the benefits of synergy? • In theory: The sharing of the benefits of synergy among the two players will depend in large part on whether the bidding firm's contribution to the creation of the synergy is unique or easily replaced. If it can be easily replaced, the bulk of the synergy benefits will accrue to the target firm. It is unique, the sharing of benefits will be much more equitable. • In practice: Target company stockholders walk away with the bulk of the gains. Bradley, Desai and Kim (1988) conclude that the benefits of synergy accrue primarily to the target firms when there are multiple bidders involved in the takeover. They estimate that the market-adjusted stock returns around the announcement of the takeover for the successful bidder to be 2%, in single bidder takeovers, and -1.33%, in contested takeovers.
Why is it so difficult to get synergy? • Synergy is often used as a plug variable in acquisitions: it is the difference between the price paid and the estimated value. • Even when synergy is valued, the valuations are incomplete and cursory. Some common manifestations include: • Valuing just the target company for synergy (You have to value the combined firm) • Not thinking about the costs of delivering synergy and the timing of gains. • Underestimating the difficulty of getting two organizaitons (with different cultures) to work together. • Failure to plan for synergy. Synergy does not show up by accident. • Failure to hold anyone responsible for delivering the synergy.
Closing Thoughts • If an acquisition is motivated by synergy, make a realistic estimate of the value of the synergy, taking into account the difficulties associated with combining the two organizations and other costs. • Do not pay this value as a premium on the acquisition. Your objective is to pay less and share in the gains. If you get into a bidding war and find you have to pay more, drop out. • Have a detailed plan for how the synergy will actually be created and hold someone responsible for it. • Follow up the merger to ensure that the promised gains actually get delivered. • Do not trust your investment bankers or anyone else in the deal to look out for your interests; they have their own. That is your job.