Download
1 / 11
110 likes | 239 Views
Net Metering Across the U.S. and in Arizona. Jason Keyes Keyes, Fox & Wiedman LLP May 29, 2013 RUCO Workshop on Net Metering and Distributed Energy. For customer-sited renewable energy generation Most systems are solar – some bio, wind, hydro

E N D
Net Metering Across the U.S.and in Arizona Jason Keyes Keyes, Fox & Wiedman LLP May 29, 2013 RUCO Workshop on Net Metering and Distributed Energy
For customer-sited renewable energy generation Most systems are solar – some bio, wind, hydro Excess kWh at one time exchanged for a kWh when needed – that night, later that month, later that year . . . “Spin the meter backwards” Lots of variations by state based on: Program size Facility size Rollover Safe Harbor / customer charges Aggregation / virtual net metering Net Metering Basics
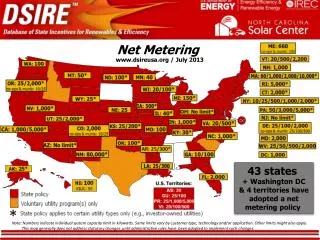
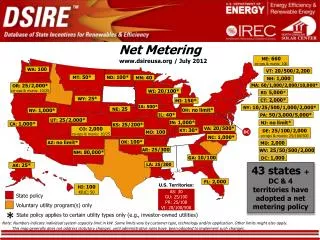
Net Metering. www.dsireusa.org / March 2013 43 states, + Washington DC & 4 territories, have adopted a net metering policy. Note: Numbers indicate individual system capacity limit in kilowatts. Some limits vary by customer type, technology and/or application. Other limits might also apply. This map generally does not address statutory changes until administrative rules have been adopted to implement such changes.
Grading States www.freeingthegrid.org • Comparison of state net metering and interconnection rules • Online with filters: able to view by key criterion and year • Updated regularly, includes DSIRE data • Collaborative effort, including IREC
Net Metering Capacity by State Approximate data through 2011 U.S. Territories 50 – 1500 MW 5 – 20 MW 20 – 50 MW .5 – 5 MW <.5 MW
Arizona: One of 15 “A” States in FTG • ACC rules for all but Salt River Project • No program cap, but program under review • Facilities cap at 125% of customer’s load • Rollover to end of year, then avoided cost payment • Customer owns the RECs • Third party ownership allowed / used for 90% of systems • Meter aggregation not addressed • 14,000 systems in APS service territory Not SRP
Problems Concern about rate impacts is stalling program expansion, leading to proposed customer charges or VOSTs High up-front costs Gradually shifting utility peak demand to later hours No practical access to net metering (shading, renting, etc.) And Solutions Rate Impact studies showing minimal impacts Costs plummeting / third party ownership (90% in AZ) Potential to load shift utility peak back to daytime New models opening new markets: aggregate net metering, virtual net metering, community solar, feed-in-tariffs Where Are We Heading?
IREC Supporting Material • www.irecusa.org/publications • IREC model net metering rules • Connecting to the Grid Guide • Community Solar Guide • US Solar Market Trends 2012 • www.freeingthegrid.org • www.solarabcs.org/rateimpact • www.dsireusa.org
Thank YouJason KeyesKeyes, Fox & Wiedman LLPjkeyes@kfwlaw.com206-919-4960