MULTIPLE PET TRACERS IN STS TREATMENT RESPONSE
260 likes | 434 Views
MULTIPLE PET TRACERS IN STS TREATMENT RESPONSE. 1 University of Washington Medical Center and 2 Children’s Hospital and Regional Medical Center, Seattle, Washington, USA. UNIVERSITY OF WASHINGYON SEATTLE CANCER CARE ALLIANCE CHILDRENS HOSPITAL SEATTLE, WASHINGTON.

MULTIPLE PET TRACERS IN STS TREATMENT RESPONSE
E N D
Presentation Transcript
MULTIPLE PET TRACERS IN STSTREATMENT RESPONSE 1University of Washington Medical Center and 2Children’s Hospital and Regional Medical Center, Seattle, Washington, USA UNIVERSITY OF WASHINGYON SEATTLE CANCER CARE ALLIANCE CHILDRENS HOSPITAL SEATTLE, WASHINGTON E.U. CONRAD MD, J.F. EARY MD, J.E. BUTRYNSKI MD, J.M. LINK PhD, A. M. CIZIK MPH, M MUZI MS, and K.A. KROHN PhD supported by NIH NCI CA 42045, S10 RR017229-01
SARCOMA GRADING & SUBTYPESFrench Protocol 1997 • Mitoses • Differentiation • Necrosis • Grade Discrepancies = 34.6% • “Intermediate” Malignancies Were Omitted! NCI vs FRENCH SARCOMA PATH GRADE Guillou L, Coindre JM, Bonichon F, et al: Comparative Study of the National Cancer Institute and French Federation of Cancer Centers Sarcoma Group Grading Systems in a Population of 410 Adult Patients with Soft-Tissue Sarcoma, J Clin Oncol, 15(1): 350–62, 1997. Deyrup AT and Weiss SW. Grading of Soft Tissue Sarcomas: the challenge of providing precise information in an imprecise world. Histopathology 48: 43-50, 2006.
Overall Survival Disease-free Survival p<0.003 p<0.001 Sarcoma Patient SurvivalPET “GRADE” SUV < 6.0 ? Eary JF, O’Sullivan, F, Powitan Y, Kingshuk RC, Vernon C, Bruckner JD, and Conrad III EU: Sarcoma tumor FDG uptake measured by PET and patient outcome: a retrospective analysis. European Journal of Nuclear Medicine, 29(9): 1149–1154, 2002.
High-grade Bx: Myxoid & round-cell liposarcoma; no necrosis. Interm’-grade Bx: Myxoid liposarcoma; no round-cell areas, no necrosis. Necrotic Bx: No viable tumor identified. Biopsy - Sampling Error in Large Tumors GRADING “VARIANCE”?
UW NEOADJUVANT CHEMOTHERAPY FDG PETBiopsyChemo 1 Chemo 2 FDG PETChemo 3 Chemo 4 FDG PETResection Postop Chemo PET PRIOR TO BIOPSY & RESECTION
FDG PET SURVIVAL:SOFT TISSUE vs BONE vs CARTILAGE Tumor Type Mean+SD Mean+95%CI Median Log-rank (Months) (Months) SUVmax (p value) Evaluating Overall Survival Cartilage 23.9 + 16.3 23.9 + 7.41 3.9 0.008 Bone 17.6 + 16.4 17.6 + 4.56 10.0 0.505 Soft Tissue 18.7 + 15.7 18.7 + 2.68 5.6 0.002 Overall 18.9 + 16.0 18.9 + 2.18 6.0 0.003 Evaluating Disease-free Survival Cartilage 17.7 + 15.8 17.7 + 7.00 3.9 0.103 Bone 11.2 + 13.8 11.2 + 3.85 10.0 0.483 Soft Tissue 14.5 + 14.8 14.5 + 2.52 5.6 0.005 Overall 14.0 + 14.7 14.0 + 2.00 6.0 0.001 Eary JF, O’Sullivan, F, Powitan Y, Kingshuk RC, Vernon C, Bruckner JD, and Conrad III EU: Sarcoma tumor FDG uptake measured by PET and patient outcome: a retrospective analysis. European Journal of Nuclear Medicine, 29(9): 1149–1154, 2002.
Prognostic Factors for DFS Schuetze SM, Rubin BP, Vernon C, Hawkins DS, Bruckner JD, Conrad EU, Eary JF. Use of PET in Localized Extremity Soft Tissue Sarcoma Treated with Neoadjuvant Chemotherapy. CANCER 103: 329-348. 2004. > 40% < 40%
PET vs”RECIST” • ASCO 2005 Schuetze Eary,Conrad et al • Prospective series ( n= 33) • 2 cycles(poor resp) vs 4 cycles(good resp) • MRI vs PET(40%) vs Histologic Response • FDG PET vs Path p=0.092 • RECIST did not predict Path p=0.002
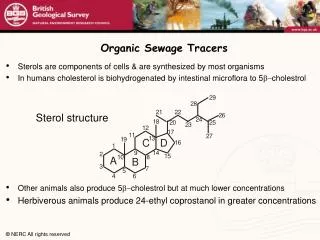
Proliferative Rate Thymidine & Analogs Glycolytic Rate FDG Hypoxia FMISO, EF1, ATSM Efflux Pumps MIBI, Verapamil, Colchicine Factors in Response and Resistance
MULTIPLE IMAGING FDG—Water—Thymidine PRE CHEMO Pre-Chemo PET Post-Chemo PET POST CHEMO PREOP FDG PERFUSION (H2O) THYMIDINE
Verapamil Model • P-glycoprotein Substrate (similar to Adriamycin) • Quantify Serial Scans vs. Patient Baseline • P-glycoprotein Inactivated by Cyclosporin,etc. • Does Chemo Induce P-gp Activity ? • Hendrikse NH, de Vries EGE, Franssen EJF, Vaalburg W, van der Graaf WTA. C-11 Verapamil kinetics in human tissue. EJCP 2001.
Primate Human (Brain) P-gP Active Brain P-gp Blocked UW Verapamil (Preliminary Studies ) CYCLOSPORIN
Specific Aims • Specific Aim 1: Correlate [C-11]thymidine uptake in sarcoma patients with histologic, immunohistochemical, and gene expression profiles. • Specific Aim 2: Perform pre-and post-chemotherapy hypoxia imaging with [F-18] fluoromisonidazole (FMISO) and correlate imaging results with tissue hypoxia markers. • Specific Aim 3: Quantitate the efflux of [C-11] verapamil in sarcoma tumors in vivo and correlate with tissue molecular markers for p-glycoprotein pump and drug-resistance markers.
METHODOLOGY: METHODS: SYNTHESIS AGENTS& IMAGING DATA COLLECTION &ANALYSIS MODELING BLOOD FLOW Resection Thymidine 2 Verapamil 1 Verapamil 2 Followed by FMISO 2 Chemo +/- A Biopsy FMISO 1 Chemo 1 3X Chemo FMISO 3 XRT Then follow- Thymidine 1 Thymidine 3 up Water 1 Water 2 Imaging Imaging Imaging Study Study Study 1 2 3
Pre-Neoadjuvant Chemotherapy on MRI 501 Status Post-2Cycles Neoadjuvant Chemotherapy on MRI
Pre-Neoadjuvant Chemotherapy on MRI 502 Status Post-2 Cycles Neoadjuvant Chemotherapy on MRI
Pre-Neoadjuvant Chemotherapy on MRI 503 Status Post-2 Cycles Neoadjuvant Chemotherapy on MRI
504 Pre-Neoadjuvant Chemotherapy on MRI Status Post-2 Cycles Neoadjuvant Chemotherapy on MRI
PRE THERAPY POST THERAPY FDG -48% Blood Flow -7% Liposarcoma Thymidine -32% Verapamil -27% FMISO -5%
Pre-Neoadjuvant Chemotherapy on MRI 503 Poor Responder - MFH Status Post-2 Weeks Neoadjuvant Chemotherapy on MRI FDG +257% TdR -3% FMISO +164%
Gene ArrayData Results – Pending • Gene Array Correlation with F-MISO, Verapmil and Thymidine • Tumor Heterogenity Mapping Nielsen TO, West RB…, and van de Rijn M, et al: Molecular characterisation of soft tissue tumors: a gene expression study. The Lancet, 359: 1301–1307, 2002.
MULTIPLE PET TRACERS: T2 coronal MRI Post-Therapy Pre-Therapy Water (20-80s) Verapamil (5-25m)
SARCOMA CHALLENGES- ASSESSING GRADE : • 1. CLINICAL “GRADE”: • Soft Tissue Density, Depth, Size • 2. MRI “GRADE”: • Size. T2(fluid), inflam zone, • “Heterogeneity”(density/necrosis) • 3. PET “SUV” GRADE: • INITIAL/PRE-CHEMO vs POST- • CHEMO • “FINAL GRADE” ?