Indifference Analysis
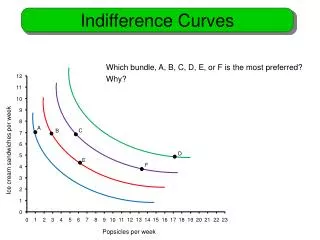
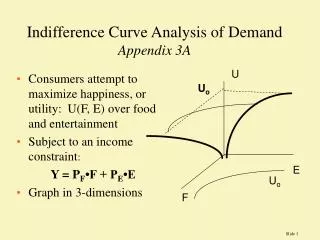
Indifference Analysis. Shape of ‘Clive’s’ an indifference curve. a. Notice that this curve is downward sloping Why is this and does it have any economic meaning?. b. c. Pears. d. e. f. g. Oranges. INDIFFERENCE ANALYSIS.


Indifference Analysis
E N D
Presentation Transcript
Shape of ‘Clive’s’ an indifference curve a Notice that this curve is downward sloping Why is this and does it have any economic meaning? b c Pears d e f g Oranges
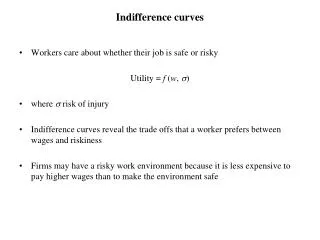
INDIFFERENCE ANALYSIS • To see the special significance of its shape we need to look at a concept known as the • diminishing marginal rate of substitution
INDIFFERENCE ANALYSIS • The rate of Substitution is the rate we are prepared to exchange Pears (Y) for Oranges (X). • Or: If I give ‘Clive’ one more orange how many pears must I take away to leave him just as happy…
The MRS of Y for X is: Pears Point Oranges a b c d e f g 30 24 20 14 10 8 6 6 7 8 10 13 15 20
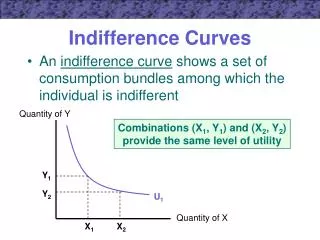
Deriving the marginal rate of substitution (MRS) a b 24 Units of good Y 6 7 Units of good X
Deriving the marginal rate of substitution (MRS) a MRS = DY/ DX= - 6 DY = - 6 b 24 DX = 1 Units of good Y 6 7 Units of good X
Pears Point Oranges a b c d e f g 30 24 20 14 10 9 6 6 7 8 10 13 14 20 Consider instead the MRS at 13 oranges a MRS = DY/ DX= - 6 DY = - 6 b 24 DX = 1 Units of good Y 6 7 Units of good X
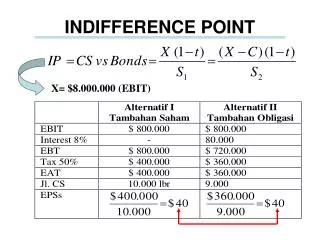
Deriving the marginal rate of substitution (MRS) Pears Point Oranges a b c d e f g 30 24 20 14 10 9 6 6 7 8 10 13 14 20 a MRS = - 6 DY = - 6 b 24 DX = 1 Units of good Y MRS = - 1 c d DY = - 1 9 DX = 1 6 7 13 14 Units of good X
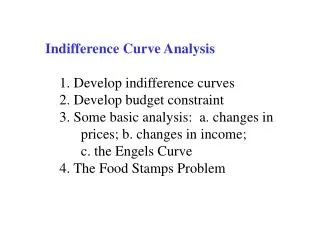
INDIFFERENCE ANALYSIS • From an Indifference curves to an indifference Map • An indifference curve tells us the bundles which give Clive the same happiness as 13 pears and 10 oranges. • An indifference map shows us a whole series of different curves showing which bundles give different levels of happiness
An indifference map Units of good Y I1 I1 Units of good X
An indifference map Units of good Y I2 I1 Units of good X
An indifference map Units of good Y I3 I2 I1 Units of good X
An indifference map Units of good Y I4 I3 I2 I1 Units of good X
An indifference map Units of good Y I5 I4 I3 I2 I1 Units of good X
An indifference map This is basically a map of the happiness mountain The further up we are, the happier we are Units of good Y I5 I4 I3 I2 I1 Units of good X
‘We’re Climbing up the Sunshine Mountain’ • We can think of picking bundles of goods as an attempt to climb the happiness mountain.
‘We’re Climbing up the Sunshine Mountain’ • A mountain of course is three dimensional and it is difficult to view on a screen.This might be a side view.
Gradually rotating and looking down from above it looks like this:
Gradually rotating and looking down from above it looks like this:
Gradually rotating and looking down from above it looks like this:
Gradually rotating and looking down from above it looks like this:
Gradually rotating and looking down from above it looks like this:
Gradually rotating and looking down from above it looks like this:
For a given Y, the more X we have the happier we are: Y Y0 X
Similarly, for a given X, the more Y we have the happier we are: Y Y0 X X0
Of course the issue about the happiness mountain is that we never get there Y Y0 X
Of course the issue about the happiness mountain is that we never get there.So we are interested in just one corner of the mountain Y0 This is basically the indifference map we started with a while ago X X0
An indifference map Units of good Y I5 I4 I3 I2 I1 Units of good X
An indifference map Note for a given quantity of x, a rise in y increases our utility, from I1 to I4 Units of good Y I5 I4 I3 I2 I1 Units of good X
An indifference map Similarly, for a given quantity of y, a rise in x increases our utility, from I2 to I5 Units of good Y I5 I4 I3 I2 I1 Units of good X
An indifference map So to labour the point, anything to the right an upwards increases our utility Down and left decreases it Units of good Y I5 I4 I3 I2 I1 Units of good X
Could two indifference curves ever cross? Units of good Y I1 Units of good X
Could two indifference curves ever cross? I2 Could we get this? Units of good Y I1 Units of good X
Could two indifference curves ever cross? Could we get this? I2 Consider points a,b and c Point a is indifferent to b And point a is indifferent to c Units of good Y => b is indifferent to c a b I1 c Units of good X
Could two indifference curves ever cross? Could we get this? I2 Consider points a,b and c But point b has more X and Y than c so b is preferred to C Contradiction, so indifference curves can never cross Units of good Y a b I1 c Units of good X
An indifference map So just like the map of a mountain, our contours of happiness (the indifference curves) never cross. Units of good Y I5 I4 I3 I2 I1 Units of good X
INDIFFERENCE ANALYSIS • We now have a map which represents peoples’ choices. What else do we need to make an economic decision about what to consume? • Answer: Information on prices and Income • The budget line: • Suppose the Price of X is Px • And the Price of Y is Py • And Income is represented by I
Budget Line • Our expenditure on X (PxX) and Y (PyY) must sum to our total income:
Budget Line • Our expenditure on X and Y must sum to our total income: If Y =0, then 2X = 30 and Max Consumption of X = 15
Budget Line • Our expenditure on X and Y must sum to our total income: If X= 0, then 1Y =30 and Max Consumption of Y = 30
A budget line Point on budget line Units of good X 0 15 Units of good Y 30 0 a Point on budget line a b Units of good X 0 15 Units of good Y 30 0 Units of good Y Assumptions PX = £2 PY = £1 Budget = £30 Units of good X
We join these two points to get the budget line Point on budget line Units of good X 0 15 Units of good Y 30 0 a Units of good Y Assumptions PX = £2 PY = £1 Budget = £30 Units of good X
A budget line Point on budget line Units of good X 0 15 Units of good Y 30 0 a Point on budget line a Units of good Y Assumptions PX = £2 PY = £1 Budget = £30 Units of good X