Download
1 / 32
330 likes | 773 Views
Diagnostic and Predictive Maintenance Applications of PI. OSI Users Conference 2002 John A. Mihevic Robert L. Norman. Central Process Distributed Control System ( CP-DCS). CAD. ED. CAEB. ERB. CP-DCS Customers. Wind Tunnels (10x10, 8x6/9x15, IRT) Propulsion Systems Lab

E N D
Diagnostic and Predictive Maintenance Applications of PI OSI Users Conference 2002 John A. Mihevic Robert L. Norman
Central Process Distributed Control System(CP-DCS) CAD ED CAEB ERB
CP-DCS Customers • Wind Tunnels (10x10, 8x6/9x15, IRT) • Propulsion Systems Lab • Icing Research Tunnel • Engine Components Research Lab • Rocket Combustion Lab • Aeroacoustic Propulsion Lab • Compressor, Turbine and Combustor Test Cells
Major Systems (ED & CAD) • ED (Electrical Dispatch) • 13 Substations ==> 138,000V to 2400V • Max Power Available = 370MW • Base (Institutional Load) = 21MW • 212,000 MWHR ==>Annual Usage • CAD (Central Air Dispatch) • Over 600+ Remotely Operated Valves • Combustion Air Distribution Piping => 16,000 Ft • Exhaust Distribution Piping ==> 7,000 Ft
Major Systems (CAEB) • CAEB (Central Air Equipment Building) • 7 Compressors (107,000Hp) • 40, 150, 450 Psig • Flow ==> 400 lb/sec @ 150Psig • 8 Exhausters (106,000 Hp) • Altitude ==> 90,000 Ft. • Flow ==> 700 Lb/Sec @ 19,000 Ft. • 2 Variable Frequency Mg’s (5000 Hp) • 1 Static Frequency Converter (7500 Hp) • 3 Turboexpanders • -90 Deg F
Major Systems (ERB) • ERB • 9 Compressors (29,100 Hp) • 40, 150, 450, 1250 Psig • Flow ==> 88 lb/sec @ 40Psig • 10 Exhausters (16,900 Hp) • Flow ==> 35 Lb/Sec @26” Vacuum • 1 Turboexpander/Compressor • -70 Deg F • Variable Frequency • 9 Rotating Converters • 15,000 Hp • 10 Hz ==> 120 Hz
Hardware Configuration • 3 Data Highway Rings • 13.5 Miles of Coaxial Data Highway Cable • 22 Operator Control Stations • 5 Field Operator Stations (Monitor Only) • 1 Software Development Station • 3 Engineering Stations • 1 PI Central Data Archive Station
Hardware Configuration (Continued) • 67 Remote Processors Communicating to: • Directly to 4050 I/O • 29 PLC’s to 9500 I/O • 50 Process/Surge Avoidance Controllers • 23 Power Monitoring Panel Meters • 2 Vibration Monitoring/Analysis Systems
Growth of System I/O • 1983 (Initial SCADA) • 3740 Pts • 1992 (Upgrade to DCS) • 9,950 Pts • 1996 • 11,700 Pts • 1999 -- PI System Installed • 2001 • 16,000 Pts
Uses of PI System • All 12,000 Pts archived (console database) • 3 Yr. of Data Available on Line • Diagnostics, Operator Process Screen Playback • Analysis • Defense of Control System • Machine Run Time/Start Log • Predictive Maintenance
PI-For Diagnostics • PI Archive Playback of Process Graphic used for Diagnostic/troubleshooting of problems/operator errors • Process graphic uses a bit map image of the operator console graphic • Dynamic points (Analog & Digital) populate the graphic from the PI history file. • Future enhancement includes a method where two graphics will not have to be maintained (the operator console graphic & the archive bit map image)
PI--For Analysis • Advanced Subsonic Compressor (1250 Psig) loss of outlet pressure--also compressor overheating • Used PI trend to establish the exact time/date of transient decrease in outlet pressure • Determined from trend of compressor inlet control valve & surge avoidance recycle valve that compressor seal had failed • Replaced compressor seal. Modified operating sequence to extend Compressor depressurization ramp time. Modified recycle valve surge control line • Rapid identification of problem provided cost savings of $100,000 by preventing major damage to the Compressor
PI-For Defense • Guide Vane Control was Suspect for Compressor Wheel failure due to Surge • PI archive proved compressor guide vane servo positioning system response was as designed--compressor was not operating in surge • After disassembly of compressor, it was determined that compressor wheel to casing clearance was not per spec--this caused wheel interference with casing and subsequent destruction • Compressor Pressure Control Suspect in Burst Disc Rupture. • Control set point was 40 Psig. Burst disc rupture point was 60 Psig. PI trend proved three pressure taps located at burst disc never exceeded 47 Psig • Determined failure due to defective burst disc
PI-For Defense (Continued) • Exciter suspect in loss of Field Excitation to 16,000Hp Compressor Drive Motors • Pi archive proved that the DC Exciter set point from the drive motor Static Frequency Converter (SFC) went erroneously to zero • Set point from the SFC to the Exciter was corrected and the problem was solved
Runtime Calculations • Old system used elapsed timer blocks in Bailey function code • New features such as Utilization and Availability were difficult to code in function blocks • Data could be lost on download of MFP • Backup Scheme was complex and unreliable, requiring data to be sent to multiple MFPs across the DCS data highway • Data was available only on operator consoles
PI to the Rescue • NASA got PI system as part of Year 2000 upgrade project • Runtime, Availability and Utilization were much easier to track in PI system • Motor status data was already being archived, simple Datalink Calculation could determine runtimes based on date passed to it • Simple Performance equation points were added to track the availability and utilization • Added check for equipment that had not run in 14 days
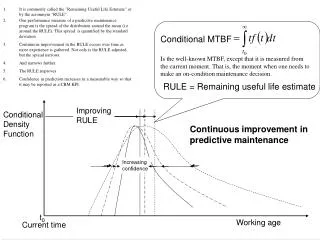
Predictive Machine Maintenance • Previously large equipment inspection and maintenance was done every 3 years • Machine Tear-downs are expensive, not only in financial aspects, but also with regards to research. • PI system was utilized as a way to track Machine run hours and starts. • Now inspections are done every 4000 hours or 600 starts.
Predictive Machine Maintenance • System uses same types of Datalink expressions used to calculate runtimes • Datalink function used to filter motor data and return number of starts over given period of time =PICompFilDat(005-0165, 01-Jan-02 00:00:00, 01-Feb-02 00:00:00, '005-0165' ="STRT" and prevval('005-0165', 01-Feb-02 00:00:00) = "OFF" ,0,1,) • Excel functions then take runtime and start data to estimate the next inspection date for each piece of equipment. • Excel functions also used to estimate number of starts prior to installation of PI server, if the last inspection date is prior to 2/01/99. The date the PI server came online at Glenn
PI-ACE vs. Performance Equations PI-ACE: What is it? • Advanced Computing Engine • Performance Equations on Steroids • More advanced and complex calculations possible • Flexible scheduling (event, clock, natural) • Visual Basic based applications, simplify development and debugging • Support for calculations involving tags from multiple PI servers
PI-ACE vs Performance Equations PI-ACE: What is it? (cont.) • Support for PI module database structure, easy to organize and group points • Support for 3rd party applications, COM Object Automation and user defined functions
PI-ACE VERSION of Runtime Equations • Module database used to organize and group PI points • Single PI-ACE app developed to calculate data • Module database objects as context or parameter for the application • New ability to launch external application to email or notify operator if system needs to run
PI Module Database Structure for Runtime points PI Tags T-005-0165UD Daily Utilization T-005-0165AD Daily Availability 005-0165LS Last Run Status 005-0165 Motor Status T-005-0178UD Daily Utilization T-005-0178AD Daily Availability 005-0178LS Last Run Status 005-0178 Motor Status T-005-200UD Daily Utilization T-005-0165AD Daily Availability 005-0200LS Last Run Status 005-0200 Motor Status
PI-ACE and PE equation comparision ACE Application PE Equations T-005-0165AD:IF(NOT(BadVal('005-0165')) AND ( TIMEEQ('005-0165','Y','T',"RUN") > 0 OR TIMEEQ('005-0165','Y','T',"INVL") < 57600)) THEN 100 ELSE 0 Public SubActualPerformanceEquations() Dim TimeRun, TimeInvalid As Date Dim mailmsg As NewMail If Trigger.IsGood Then TimeRun = Trigger.TimeEQ(Now, Now - 1, "RUN") TimeInvalid = Trigger.TimeEQ(Now, Now - 1, "INVL") IfTimeRun > 0 Then Utilization.Value = 100 Availability.Value = 100 Else Utilization.Value = 0 If TimeInvalid < 57600 Then Availability.Value = 100 Else Availability.Value = 0 End If End If 'Has Machine Run in past 14 Days LastRun.Value = Trigger.TimeEQ(Now, Now - 14, "RUN") If LastRun.Value = 0 Then Set mailmsg = New NewMail mailmsg.Send "PIACE@cpdcs.grc.nasa.gov", "Operations@cpdcs.grc.nasa.gov", _ Trigger.Desc & "Run Status", _ Trigger.Desc & "has not run for the past 14 Days" End If Availability.Value = 0 Utilization.Value = 0 End If End Sub T-005-0165UD: IF(BadVal('005-0165') OR TIMEEQ('005-0165','Y','T',"RUN") <= 0) THEN 0 ELSE 100 005-0165-LS:FINDEQ('005-0165','*','01-Feb-99 00:00:00',"RUN") < '*-14D'
Add new context for each piece of equipment in the “runtime” module. Set offset and period for schedule Schedule PI-ACE Application to run
PI-ACE VERSION of Predictive Maintenance • Again Module database could be used to organize and group PI points • Simplify equation development and maintenance • Current spreadsheet version takes a long time to calculate, using PI-ACE it could be scheduled at night • PI-ACE Application could store calculated data in Access table or HTML for easy/quick viewing • New version could calculate and evaluate Next Inspection Date, and submit a work order to the Maintenance Management System
Possible Future use for PI-ACE • NASA is moving towards full cost accounting for Test Cell Research • Computing Test Cell operating costs is a complex process, involving power consumption and mass flow rates for Test Cells and machines used • Costs must be distributed against additional test cells that are using same equipment • PI-ACE could be used to calculate time-weighted averages of flows and MW usage • PI-ACE calculated data could be exported to NASA billing and accounting systems